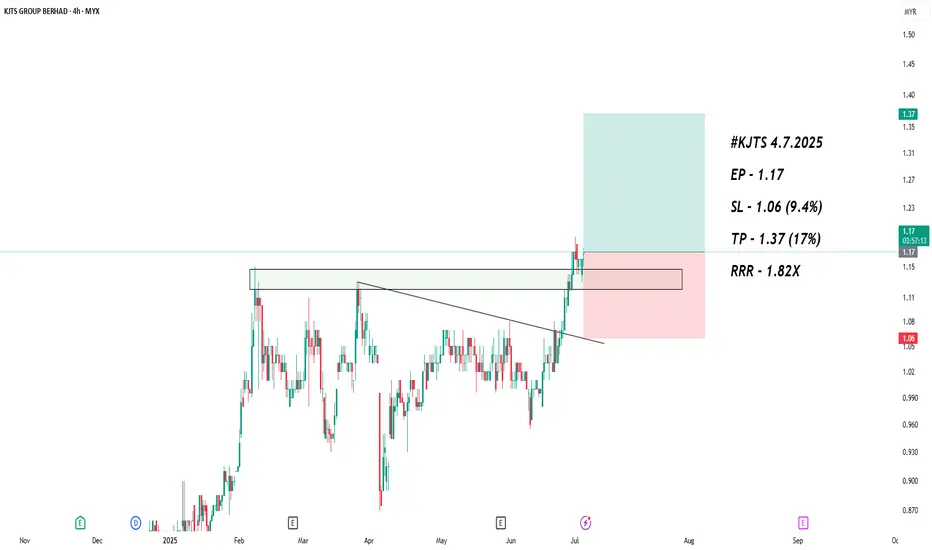
KJTS CONT MARKING UPThis is just a continuation of my prev thesis
**please refer to the link below
Turned out, KJTS formed Type #2 Schematic of Reaccmulation (Rising Bottom)
As it looks now, current price action seems to be confirming BUEC
**Buec is part of Phase D of Wyckoff Event
Noticed the formation of
Next report date
—
Report period
—
EPS estimate
—
Revenue estimate
—
0.02 MYR
8.10 M MYR
137.75 M MYR
284.80 M
About KJTS GROUP BERHAD
Sector
CEO
Kok Choon Lee
Website
Headquarters
Kuala Lumpur
Founded
2022
ISIN
MYQ0293OO009
FIGI
BBG01KWT90J5
KJTS Group Bhd. is an investment holding company, which engages in the provision of building support services comprising cooling energy, cleaning, and FM services. It operates through the following segments: Cooling Energy, Cleaning Services, Facilities Management, and Building Construction. The Cooling Energy segment is involved in supplying chilled water for space cooling; providing operations and maintenance services for cooling energy systems; and constructing new, upgrading, and retrofitting of cooling energy systems. The Cleaning Services segment includes maintaining cleanliness, tidiness, and hygiene of buildings and outdoor areas. The Facilities Management segment focuses on repair and maintenance of machinery and equipment. The Building Construction segment offers construction of buildings. The company was founded on June 3, 2022 and is headquartered in Kuala Lumpur, Malaysia.
Related stocks

KJTS MARKING UPA typical Re-Accumulation Schematic #1
It is very difficult to get this kind of shcematic
With a successful test of spring
What intrigued me, vol @ 21/4/25 (black arrow)
-too shallow accompanied with contraction (Typical of Feather's Weight **Yellow Line)
Thus position intiated as attache

KJTS Group BerhadKJTS Group Berhad
Trend: The stock shows an overall uptrend since February, with higher lows and higher highs.
Price Action: There's significant volatility, with large price swings and several gap-up and gap-down movements.
Support and Resistance:
Current support level appears to be around 0.70

KJTS start pullback >> Pullback in the making....
>> monitor whether it will stay above or below 0.555 area.
When the market moves where, and how, and if - these are all unknown. The only thing which we can control is our risk. Focus on risk management!
Keep the long term vision.
Disclaimer :
Please be informed tha

KJTS, still will push?>> stochastic OS
>> Price below Hull MA red
>> RSI still OB
Potential strong rebound at 0.555 area?🧐
Buy and sell so you can sleep better at night. But if you lose your sleep after you buy or sell. Then have to evaluate why you buy or sell....🤔
Disclaimer: Mentioned stocks are solely based on o

KJTSThis Week FORECAST
Opportunity for KJTS. This setup trading idea is for intraday. >> TAYOR
Risk Factors:
1. Market conditions, unexpected news, or external events could impact the trade.
2. Always use risk management strategies to protect your capital.

See all ideas
Summarizing what the indicators are suggesting.
Neutral
SellBuy
Strong sellStrong buy
Strong sellSellNeutralBuyStrong buy
Neutral
SellBuy
Strong sellStrong buy
Strong sellSellNeutralBuyStrong buy
Neutral
SellBuy
Strong sellStrong buy
Strong sellSellNeutralBuyStrong buy
An aggregate view of professional's ratings.
Neutral
SellBuy
Strong sellStrong buy
Strong sellSellNeutralBuyStrong buy
Neutral
SellBuy
Strong sellStrong buy
Strong sellSellNeutralBuyStrong buy
Neutral
SellBuy
Strong sellStrong buy
Strong sellSellNeutralBuyStrong buy
Displays a symbol's price movements over previous years to identify recurring trends.
Frequently Asked Questions
The current price of KJTS is 1.51 MYR — it has increased by 4.86% in the past 24 hours. Watch KJTS GROUP BERHAD stock price performance more closely on the chart.
Depending on the exchange, the stock ticker may vary. For instance, on MYX exchange KJTS GROUP BERHAD stocks are traded under the ticker KJTS.
KJTS stock has risen by 16.15% compared to the previous week, the month change is a 29.06% rise, over the last year KJTS GROUP BERHAD has showed a 147.54% increase.
We've gathered analysts' opinions on KJTS GROUP BERHAD future price: according to them, KJTS price has a max estimate of 2.12 MYR and a min estimate of 2.12 MYR. Watch KJTS chart and read a more detailed KJTS GROUP BERHAD stock forecast: see what analysts think of KJTS GROUP BERHAD and suggest that you do with its stocks.
KJTS reached its all-time high on Jul 31, 2025 with the price of 1.35 MYR, and its all-time low was 0.41 MYR and was reached on Jan 29, 2024. View more price dynamics on KJTS chart.
See other stocks reaching their highest and lowest prices.
See other stocks reaching their highest and lowest prices.
KJTS stock is 4.05% volatile and has beta coefficient of 1.02. Track KJTS GROUP BERHAD stock price on the chart and check out the list of the most volatile stocks — is KJTS GROUP BERHAD there?
Yes, you can track KJTS GROUP BERHAD financials in yearly and quarterly reports right on TradingView.
KJTS GROUP BERHAD is going to release the next earnings report on Sep 3, 2025. Keep track of upcoming events with our Earnings Calendar.
KJTS net income for the last quarter is 4.23 M MYR, while the quarter before that showed 3.39 M MYR of net income which accounts for 24.64% change. Track more KJTS GROUP BERHAD financial stats to get the full picture.
Yes, KJTS dividends are paid annually. The last dividend per share was 0.00 MYR. As of today, Dividend Yield (TTM)% is 0.37%. Tracking KJTS GROUP BERHAD dividends might help you take more informed decisions.
As of Aug 6, 2025, the company has 1.48 K employees. See our rating of the largest employees — is KJTS GROUP BERHAD on this list?
EBITDA measures a company's operating performance, its growth signifies an improvement in the efficiency of a company. KJTS GROUP BERHAD EBITDA is 14.35 M MYR, and current EBITDA margin is 6.89%. See more stats in KJTS GROUP BERHAD financial statements.
Like other stocks, KJTS shares are traded on stock exchanges, e.g. Nasdaq, Nyse, Euronext, and the easiest way to buy them is through an online stock broker. To do this, you need to open an account and follow a broker's procedures, then start trading. You can trade KJTS GROUP BERHAD stock right from TradingView charts — choose your broker and connect to your account.
Investing in stocks requires a comprehensive research: you should carefully study all the available data, e.g. company's financials, related news, and its technical analysis. So KJTS GROUP BERHAD technincal analysis shows the buy rating today, and its 1 week rating is strong buy. Since market conditions are prone to changes, it's worth looking a bit further into the future — according to the 1 month rating KJTS GROUP BERHAD stock shows the strong buy signal. See more of KJTS GROUP BERHAD technicals for a more comprehensive analysis.
If you're still not sure, try looking for inspiration in our curated watchlists.
If you're still not sure, try looking for inspiration in our curated watchlists.