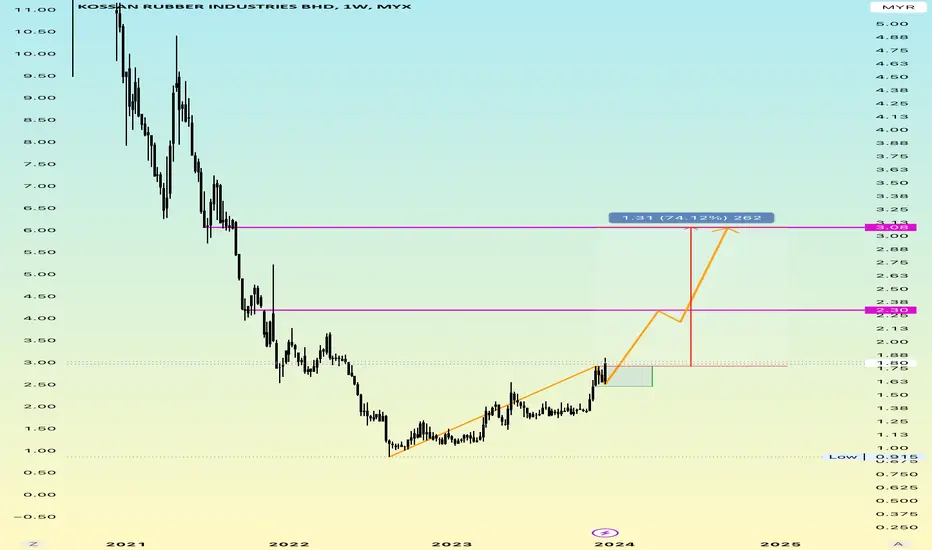
Simple13 Short Term Trading Idea (KOSSAN)Current Price: RM 2.08
Profit Target: RM 2.30
Buy Zone: RM 1.95 - RM 2.08
Entry Strategy:
Start accumulating KOSSAN shares in the buy zone between RM 1.95 and RM 2.08. This range offers a favorable risk-reward ratio.
Profit Taking:
If the price reaches RM 2.30, take profit, as this area is conside
Next report date
—
Report period
—
EPS estimate
—
Revenue estimate
—
0.05 MYR
118.33 M MYR
1.92 B MYR
1.06 B
About KOSSAN RUBBER INDUSTRIES BHD
Sector
Industry
CEO
Kuang Sia Lim
Website
Headquarters
Shah Alam
Founded
1979
ISIN
MYL7153OO009
FIGI
BBG000FHG2L0
Kossan Rubber Industries Bhd. is an investment holding company which engages in the manufacture and sale of rubber products, and the provision of management services. The firm operates through the following segments: Technical Rubber Products, Gloves, Cleanroom Products, and Others. The company was founded by Kuang Sia Lim in 1979 and is headquartered in Klang, Malaysia.
Related stocks


Kossan strong bullish coming KOSSAN TIme Frame Weekly
Hai Traders
Interesting to note
Only suitable for long term
There is a already breakout strong resistance
Just waiting until your TP ☺️
#thisonlyforpredectionstudy
#thisnotforbuycallorbuysell
#chartpattern
#TAYOR
#MFM.TRADER
Kossan. Where is its demand / base / stop? 16 / August/ 22Kossan previous major demand / base / stop was created on 29/ Dec / 2014 weekly bar as shown on chart.

Kossan. Finding its ying/Yang force with channel. 14/July/22.Kossan. Today I gonna “bullsxxxing” a “myth” about ying ( seller force ) , Yang ( buyer force ) AND neutral force ( median line of parallel channel) again “represented” with parallel channel. P/s Since tradingview “free user” don’t have enough data feed. I have to “superimposed image” by using 3rd

Kossan possible breaking ATH of 7.90 But 0.90 first. 19/June/22Disclaimer : All past, present, future chart analysis are for illustration, research, studies purpose ONLY.. Kossan among 4 kings of gloves stocks. Kossan have a potential breaking its all time high ( ATH ) Rm7.90 from coming “rally “..unlike others 3 kings ( harta, Topglove, supermx) its current do

Kossan. Glove back to pre-covid growth. 5/May/22.Kossan latest report announced that : gloves ASP ( average selling price ) have been normalizing as the industry transitions to pre-pandemic levels.. AND..and they intend to expand its capacity by building new plants..As below of the chart. Kossan EPS ( earning per share also “normalized” back to

KOSSAN RECHNICAL ANALYSIS5 hours ago
Technical analysis for KOSSAN Stock based on Trend Analysis, Chart Pattern and Fibonacci Retracement

KOSSAN maybe last leg up to≈ 3.800 before ≈2.70. 1/8/21KOSSAN possible forming a trip zig zag wave pattern as TOPGLOV chart. Where price currently both rebouncing for wave B (Cyan/Light Blue) of the wave Z (Red Circled) which is the last leg of of the triple zig zag (RED Circled wxyxz) pattern. The Next resistance for KOSSAN could be around RM3.80 wh

KOSSAN - Pre Consolidation breakoutTHIS IS NOT AN INVESTMENT ADVICE. TRADE CALLS ARE NOT PROVIDED. INFORMATION SHOWN ARE FOR TECHNICAL ANALYSIS PURPOSE.
DISCLAIMER
Please consider your own interpretation of Opportunity & Risk. The author of this post strictly follows the Malaysian Security Commission ( SC ) Guidelines on the prohibi

See all ideas
Summarizing what the indicators are suggesting.
Neutral
SellBuy
Strong sellStrong buy
Strong sellSellNeutralBuyStrong buy
Neutral
SellBuy
Strong sellStrong buy
Strong sellSellNeutralBuyStrong buy
Neutral
SellBuy
Strong sellStrong buy
Strong sellSellNeutralBuyStrong buy
An aggregate view of professional's ratings.
Neutral
SellBuy
Strong sellStrong buy
Strong sellSellNeutralBuyStrong buy
Neutral
SellBuy
Strong sellStrong buy
Strong sellSellNeutralBuyStrong buy
Neutral
SellBuy
Strong sellStrong buy
Strong sellSellNeutralBuyStrong buy
Displays a symbol's price movements over previous years to identify recurring trends.
Frequently Asked Questions
The current price of KOSSAN is 1.34 MYR — it has increased by 0.75% in the past 24 hours. Watch KOSSAN RUBBER INDUSTRIES BHD stock price performance more closely on the chart.
Depending on the exchange, the stock ticker may vary. For instance, on MYX exchange KOSSAN RUBBER INDUSTRIES BHD stocks are traded under the ticker KOSSAN.
KOSSAN stock has risen by 3.05% compared to the previous week, the month change is a −11.18% fall, over the last year KOSSAN RUBBER INDUSTRIES BHD has showed a −44.40% decrease.
We've gathered analysts' opinions on KOSSAN RUBBER INDUSTRIES BHD future price: according to them, KOSSAN price has a max estimate of 2.70 MYR and a min estimate of 1.23 MYR. Watch KOSSAN chart and read a more detailed KOSSAN RUBBER INDUSTRIES BHD stock forecast: see what analysts think of KOSSAN RUBBER INDUSTRIES BHD and suggest that you do with its stocks.
KOSSAN reached its all-time high on Aug 5, 2020 with the price of 9.75 MYR, and its all-time low was 0.03 MYR and was reached on Mar 10, 2003. View more price dynamics on KOSSAN chart.
See other stocks reaching their highest and lowest prices.
See other stocks reaching their highest and lowest prices.
KOSSAN stock is 3.03% volatile and has beta coefficient of 0.44. Track KOSSAN RUBBER INDUSTRIES BHD stock price on the chart and check out the list of the most volatile stocks — is KOSSAN RUBBER INDUSTRIES BHD there?
Today KOSSAN RUBBER INDUSTRIES BHD has the market capitalization of 3.41 B, it has decreased by −9.03% over the last week.
Yes, you can track KOSSAN RUBBER INDUSTRIES BHD financials in yearly and quarterly reports right on TradingView.
KOSSAN RUBBER INDUSTRIES BHD is going to release the next earnings report on Jul 29, 2025. Keep track of upcoming events with our Earnings Calendar.
KOSSAN net income for the last quarter is 35.65 M MYR, while the quarter before that showed 27.70 M MYR of net income which accounts for 28.70% change. Track more KOSSAN RUBBER INDUSTRIES BHD financial stats to get the full picture.
As of Jul 29, 2025, the company has 5.93 K employees. See our rating of the largest employees — is KOSSAN RUBBER INDUSTRIES BHD on this list?
EBITDA measures a company's operating performance, its growth signifies an improvement in the efficiency of a company. KOSSAN RUBBER INDUSTRIES BHD EBITDA is 241.52 M MYR, and current EBITDA margin is 10.79%. See more stats in KOSSAN RUBBER INDUSTRIES BHD financial statements.
Like other stocks, KOSSAN shares are traded on stock exchanges, e.g. Nasdaq, Nyse, Euronext, and the easiest way to buy them is through an online stock broker. To do this, you need to open an account and follow a broker's procedures, then start trading. You can trade KOSSAN RUBBER INDUSTRIES BHD stock right from TradingView charts — choose your broker and connect to your account.
Investing in stocks requires a comprehensive research: you should carefully study all the available data, e.g. company's financials, related news, and its technical analysis. So KOSSAN RUBBER INDUSTRIES BHD technincal analysis shows the sell today, and its 1 week rating is sell. Since market conditions are prone to changes, it's worth looking a bit further into the future — according to the 1 month rating KOSSAN RUBBER INDUSTRIES BHD stock shows the strong sell signal. See more of KOSSAN RUBBER INDUSTRIES BHD technicals for a more comprehensive analysis.
If you're still not sure, try looking for inspiration in our curated watchlists.
If you're still not sure, try looking for inspiration in our curated watchlists.