MN RBS already Hit, expecting Lower Low.Based on MN chart, we can see strong downtrend with volume, also MN RBS have already been retest but failed to make HH. So I am expecting price lower than MN RBS test price. Based on fibo levels, 0.215 seems a good price for entry, only expecting pullback from FR261 to FR188 (safest exit).
KRONO trade ideas

Leading diagonal of Wave 1 / Inverted HnS / Cup n Handle patternLooks like wave 2 has completed after leading diagonal of Wave 1. Price currently retraces not more than 38% of Fibo. Therefore, i anticipate that Wave 3 is going to form and might be extended according to EW principle. Price also breaks out pivot area. TAYOR.

KIVFundamental: Mixed
Candle + Volume: Side way, not exhibiting any extreme condition technically.
Rainbow: Downtrend pause at the support line (Blue EMA)
Once breakout might indicate a reversal of the prevailing trend. Just KIV


KRONO 13-10-2021TP = Take profit
EP = Entry Price
Cut loss when breakout Support level
Smartmoney in accumulation , still low ,momentum building ready to spike
Butterfly pattern emerged , if reached target TP02
Channel pattern


krono short term ideaEntry = 0.755/0.745
Support = 0.73
Resistance = 0.77/0.81/0.86
*BUY at support much safer.

KRONO bull upMACD uptrent
TP 6 % - possible double bottom trend
If breakout can up to 23 % -31 % TP
30days to test
Goodluck

TR 311. Krono weekly start to make an uptrend with the downtrendline broken and EMA 10 > EMA 30 > EMA 200. Now in Wave 4.
2. Reversal candle formed (hammer then bullish candle) at 0.5 Fibonacci level. Also RBS. Previous reversal on Wave 2 is also at 0.5 level.
3. Isaham Revenue and profit indicator in an uptrend, PE 0, WAFV 0.

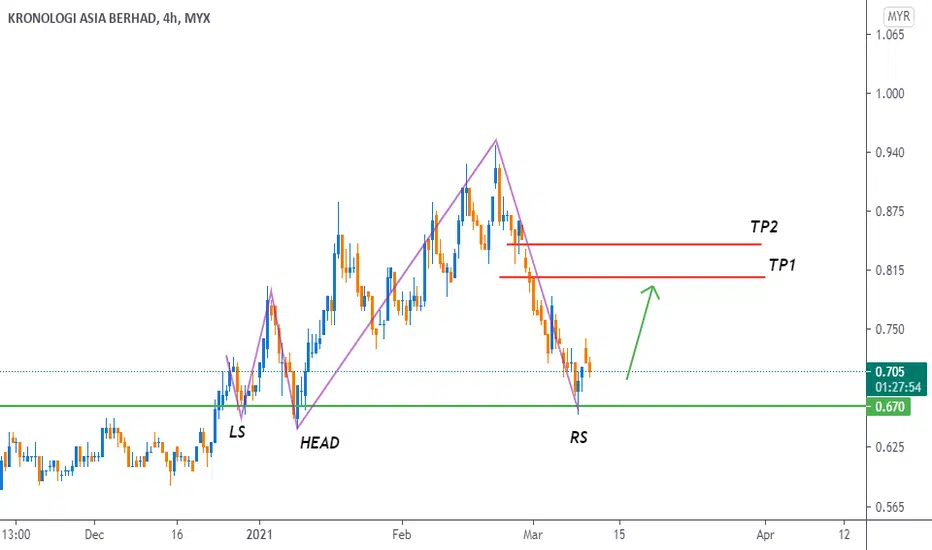
KRONOLOGI AsiaTrade ideas for this counter.
LS-Left shoulder
RS- Right shoulder.
Entry base on inverted head and shoulder reacted at SSR-significant support resistant.
CL if break HEAD
Happy Trading
Tayor
KRONO Target LongAs we can price already breakout TL H4 . Looking for buying opportunities if they are reversal sign ,buying structure form at lower TF or compression near to support area. To be safe wait until price reverse back to the breakout area before enter market, TP at nearest resistant and SL after break support.
**Disclaimer
This account is my personal journal in Stock and Forex . It is for my learning purpose and keep track ONLY.
TRADE IS HIGH RISK, THINK WISELY BEFORE ENTER MARKET.


KRONOLOGI ASIA BERHAD (3-JAN-2021)The second C&H pattern is about to complete. The price is now being traded above the rising combined 20&50-day EMA since 13 Nov 2020 and this combined EMAs also has crossed above 200-day EMA on 16-Dec-2020 which indicates a potential bullishness in the future, which is further strengthened by the green cloud kumo.
It is noticeable that since 5-Nov-2020, the SmartMCDX indicator demonstrates that the institutional fund managers have been accumulating.
The momentum is still rising despite the STO indicates overbought area but there is no divergence signal between the oscillator and price action. Enter position if price breaks above 0.725 supported by high volume which can unleash strong upside.
Next R/ TP:
• 0.845
• 0.870
• 0.96
Support:
• 0.665
• 0.645 (50-day EMA)
• 0.605 (200-day EMA)
Note: This trading idea is for educational purpose only and not to be construed as a buy call. The mantra of TAYOR and caveat emptor shall apply.

KRONO - Breaking Away from Rounding Bottom KRONO
Rst: 0.76
Spp: 0.685
Momentum is picking up, and latest 2 candles rejected earlier bearish engulfing formation means there’s high tendency to push away from RB formation, 0.685 is highly critical level for the stock to break, once break can unleash strong upside.

#KRONORanging sideway recently and price is playing above 200MA. Expecting a breakout at 0.655 and have potential to go until 0.735.
Fundamental last Quarter is profitable, Cashflow is positive as well as net profit is also positive.
But the only one that I look in fundamental that is not in my rules is it is above 30% balance float.
Anyway, we can see multiple pin bar at 200MA. This CS pattern giving a confluence who is controlling the market.

KRONO - BULLISHKrono, potentially is going to rally soon once the price breaks above 0.655.
Prepare to long.
Good luck traders!
