5192 KSSC Miss the chanceJust found this counter, RWC showed buy chance, mirage showed the yellow bar short term strong momentum, MCD showed no green color lose chips, spike volume.
but....I missed it, i did not buy it.
KSSC trade ideas

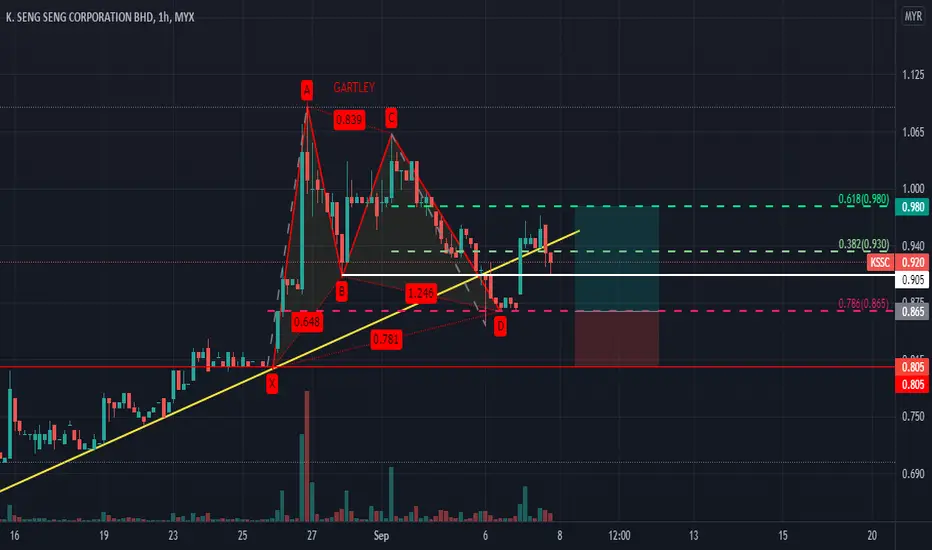
KSSC BULLISH GARTLEY PLAN VALIDBefore this im trying to use probability and possibility on this stock.
It show Bullish Gartley pattern after reverse at 0.786% (0.865).
By using FIBO retracement my expectation for TP1 and TP2 is at 0.32% and 0.618%.
#TAYOR MYX:KSSC
POSSIBILITY AND PROBABILITY KSSC STOCKFrom the drawing i try to make probability if price go up or down and from that im using Harmonic Pattern to expect the possibilty of the target price.
1. Let say if price BO from the white line (1.03) my expectation TP will achieve 1.200 at 1.618% by using CRAB Pattern.
2. If price consistance drop below red line (0.955) it will fall to 0.84 by using Bat Pattern.
if both my predictions are incorrect it means the counter will be in a sideway and can forget this counter for a while and lookup for another.
#TAYOR MYX:KSSC

KSSC - Remain BullishKSSC
Rst: 1.46
Spp: 1.28
Continue to hover above Fibo Ext 161.8% or 1.28, still bullish but the stock may take a bit longer time to run its congestion mode before the new direction is discovered.


Trading Above MA20, Broke Resistance 0.5KSSC has been trading above its upward sloping 20-Day Moving Average which is a good sign.
In addition, the price just broke the resistance of 0.5 reinforcing the bullishness in the recent price movement.
This breakout was accompanied by a higher than average volume which shows the enthusiasm of the traders to push the price higher and past this resistance hence giving a higher probability of successful breakout.
Resistance : 0.810
Support 1 : 0.355
Support 2 : 0.34
Resistance Breakout :
28 Jul : 0.384
2 Jul : 0.375
29 Jun : 0.415
17 Jun : 0.405


Tutorial: Trading in hourly and 30 minute chartTrading in shorter timeframe give a better edge.
Check if your stock fulfill the criteria below:
1. Strong background - confirmation on accumulation
2. Breakout with high volume
3. Price re-test with low volume and narrow spread
4. Hourly chart show strength during re-accumulation
5. Pentagon in hourly chart
Send us your preference stock to review based on TradeVSA chart by comment at below.
Disclaimer
This information only serves as reference information and does not constitute a buy or sell call. Conduct your own research and assessment before deciding to buy or sell any stock
