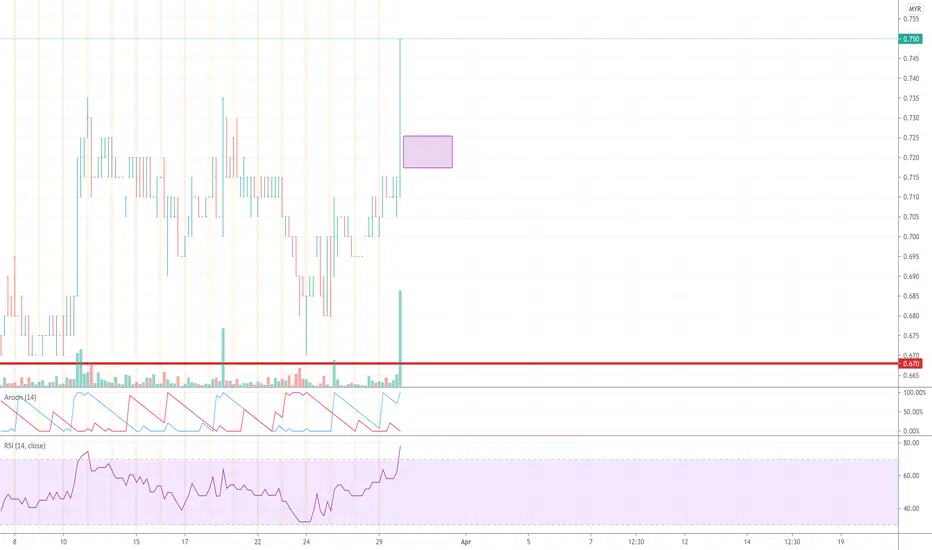
LBALUM 200-Day SMA Buy SignalsObservation
1. The price action breaks the 200-day SMA upwards (Bullish Breakouts).
2. The price bounce on the 200-day SMA two times (Support Bounce).
Forecast
1. Price might drop to bounce again for the third time or bearish breakout on the 200-day SMA.
2. Price might go for a long uptrend
Reminder
1. This counter got dividend with ex date on 2/10/2023, entitlement on 3/10/2023 and payment on 18/10/2023.
2. This is not buy and sell signal
LBALUM trade ideas

LBALUM VOLATILITY CHANGE in EW ABC COREECTIVE ZONELBALUM spotted with volatility reversal at Elliott Waves' ABC corrective zone.

VCP SETUP LBALUMFair fundamental company.Price just break above the horizontal line with high volume.

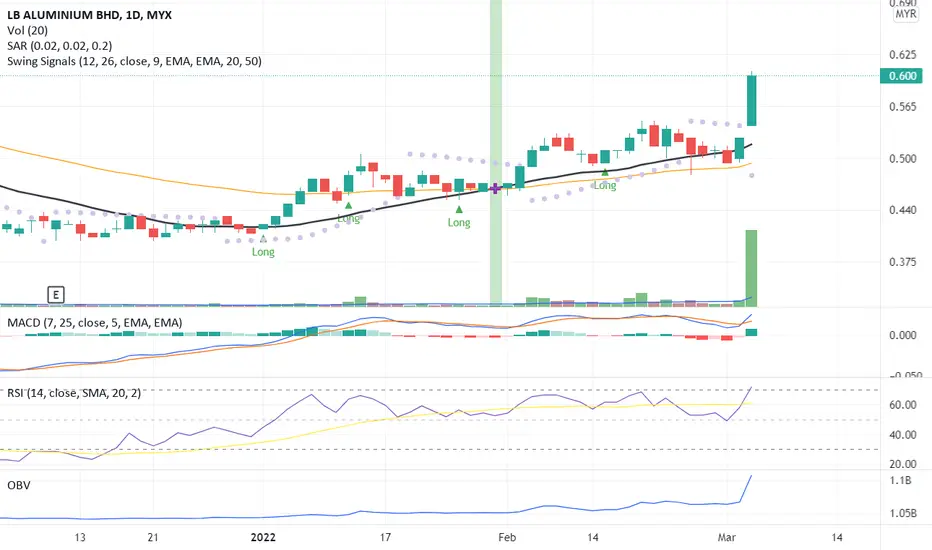
A Breakout Signal!Significant price movement together with high volume indicates the candlestick pattern in a breakout phase.
The RSI indicator confirmed the price breakout due to gains is greater than the losses where the momentum indexes >70.
MACD and OBV indicators also confirmed the price trend; a strong uptrend.
Precaution for a price correction between 10% - 20% due to traders taking a short position before continuing the uptrend towards the next price resistance.
Let's save LBALUM in WL and watch out for significant price movement with volume towards the next price resistance.
R 0.650
S 0.560
LBALUM belum ada dynamicThe chart shown potential TP and potential retracement for support.
All will be depends on market sentiment and company dynamic itself.
TAYOR.

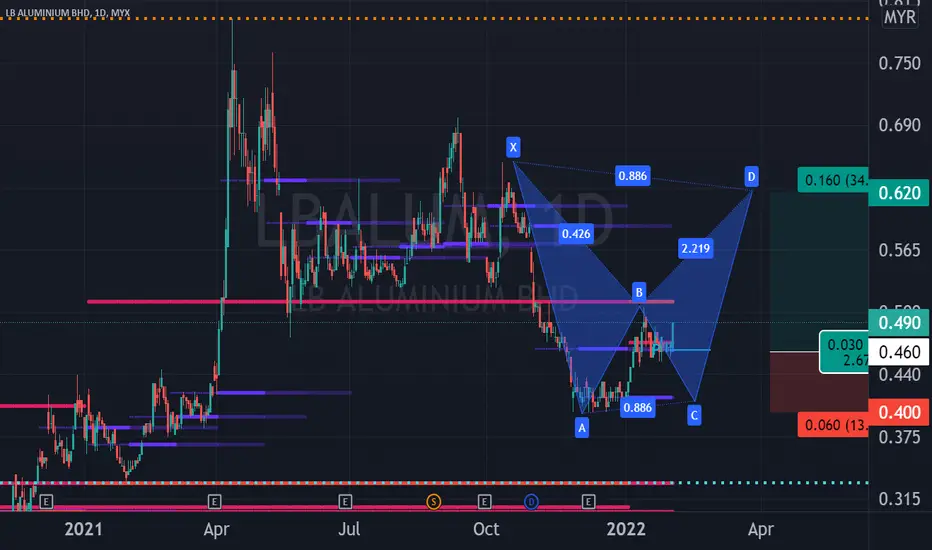
LBALUM ON ELLIOTT'S AND HARMONIC LBALUM rebounded from 0.400 as per Elliott Waves' Theory on ABC Corrective Zone on expanded flat. It is also on Bat Harmonic Pattern where the price stabilised at fibo618 of Elliott's Wave 1 to Wave 5 waves. At present, the price has crossed the daily pivot point and is heading to 0.500 yearly pivot which happens to be Point B. To enter trade, the potential proposed trading plan is depicted in the chart.
LBALUM TECHNICAL ANALYSISTechnical analysis for LBALUM Stock based on Trend Analysis, Chart Pattern and Fibonacci Retracement
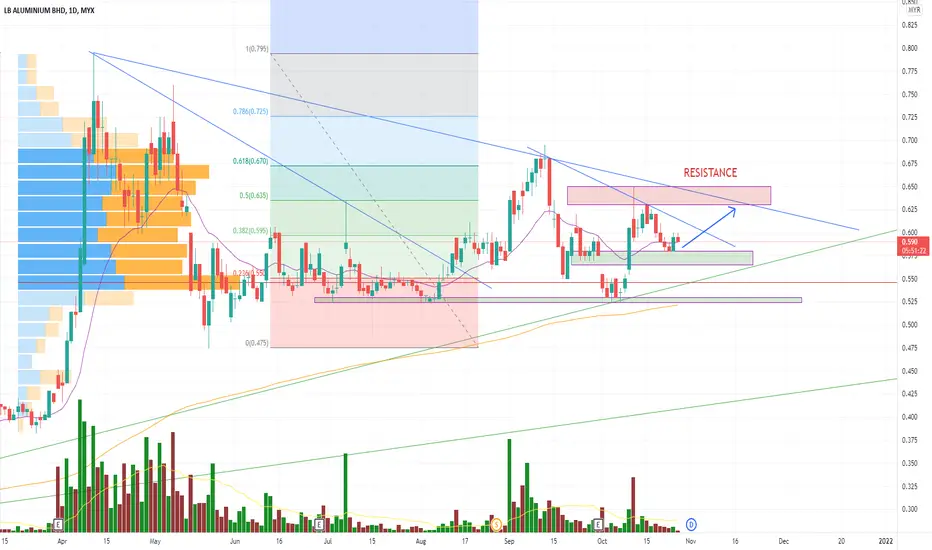
Growing Stock - upside breakoutLBALUM rose above bullish triangle continuation pattern and tested Fibonacci resistance at 0.69 with a pullback. We see a possibility of technical rebound to the upside at current support level 0.605 as the price is currently trading at resistance turns support level coincides with 61.8% Fibonacci retracement level. If this happens we expect it to move towards the short -term target at resistance level 0.69, 0.74 followed by 0.82. A reversal below support S3 at 0.52 will negate this expectation.
Disclaimer: No trading strategy provided here. Our content is intended to be used and must be used for technical analysis education purposes only

LBALUM - Try to break the BOX?Trendband area to begin with breakout candle. Possible to EP at purple box. Close monitor High and Low since Doji candle appears.

LBAlum Trend Analysisdisclaimer : this is purely for learning purpose on trend analysis using published indicators, namely, Chips Master, Trend Master, MCDX Plus.
No recommendation of buy/sell
Lbalum completed chips accumulation, first up and second up. Currently, retrace sideways.
Chips Master is used mainly for chips accumulation stage.
Trend Master and MCDX are used for first up and second up, and potentially third up, if any.

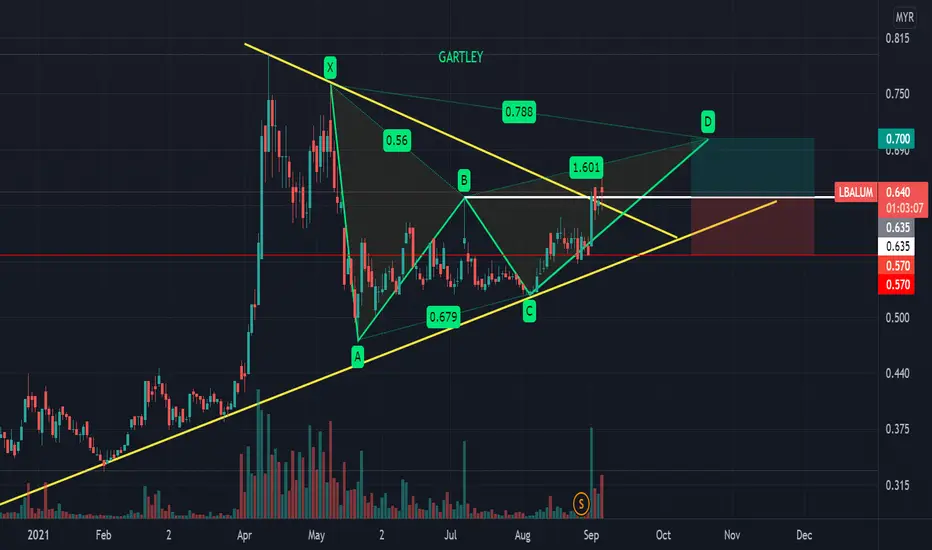
LBALUM GARTLEY SETUPMonitor if price sustain above B point (white line).
Try to setup Gartley pattern on this stock.
#TAYOR MYX:LBALUM

LBALUM to W5? Aluminum CompanyLong Term for me to W5.
Engaged in the business of manufacturing, marketing and trading of aluminum extrusions. The Company's geographical segments include Malaysia, Singapore and Others. The Company, through its subsidiaries, is engaged in marketing and trading of aluminum hardware and other fittings; trading of aluminum sheets and other metal products; retail and trading of aluminum extrusion and accessories, and property holding. Its products include Extrusion, Expanded Mesh, Aluminium Sheets/Coil, Albe Tee Ceiling Suspension System and Fitting & Accessories. It also supplies extrusions for the fabrication of rolling shutters, patio doors, awning system, as well as for gate railings, fencing and grilles. The Company's production facilities are located on a 32-acre site in Beranang in the state of Selangor. The Company provides value added services to its customers, such as cutting, degreasing, punching, stamping, assemble and packing as original equipment manufacturer (OEM).

LBALUM Daily TimeframeSimple way of 1-2-3 with 50% retrace/rest/accumulate/profit taking prior to next target with morning star as initial engine

#LBALUM - Golden Wave - Elliot wave (Impulse)The most of strongest Momentum wave - Golden Wave (impulse)
Criteria :
Minor wave 3 in 3rd impulse major Elliot Wave
Strong Bullish Momentum volume unusual
Steepness of a trend line increases from 45% to 70% deg
Strong Break in bar retracement symmetry leading to a change in trend behavior
Bullish gap up price action

granpa kyy says lbalum is underratedevery signal is indicating an overbought position. price may waterfall any time. small support at 0.90 n stronger support at 0.755. want my opinion? better wait on the sidelines 1st.

LBALUM riding on the aluminium demand trendEntry: 0.55-0.56
TP: Yellow
Support: Blue
Cut loss: Red
Trading Ideas only / TAYOR
