kaunter LKL untuk monitor 7hb DisemberBOD
keadaaan masih sideway
RSI menunduk
utk monitor
RRR 1:2 atau 1:3 (bersedia dengan Stop limit)
menghampiri MA 20 & MA50
LKL trade ideas


LKL BOUNCE FROM SUPPORT?SUPPORT ZONE 0.78-0.895 SEEMS HOLDING WELL
MARKET SEEMS LIKE POSSIBLE BOUNCE FROM 0.90, AND HEADING TO 1.25..


Bullish trendBullish trend after deep pullback. Breakout above resistance 1.060 and ichimoko cloud.
Weekly trend still bullish.
This is just for educational purpose*

Bearish viewBearish:
1. Valid uptrend line in red violated
2. Dead cross on Oct 27
3. Growing bearish momentum seen on MACD histogram
Price could drop to next support level at Fibonacci level 1.618 at 0.715.
Disclaimer: The content on this analysis is subject to change at any time without notice, and is provided for the sole purpose of assisting traders to make independent investment decisions.


Breakout Resistance1. Will go higher if break the resistance
2. This stock related to the Covid-19
3. Will continue uptrend till new cases slow down or eradicate

LKL 6/10/2020Masih dalam fasa uptrend, di penghujung Volatility Contraction Pattern (VCP) pattern. Last price masih di atas MA 50. Sektor healthcare boleh diperhatikan, kemungkinan last lap untuk wave 5.
**Penafian : Kajian hanya untuk tujuan pembelajaran, sila lakukan kajian dan trading plan terlebih dahulu.


LKL - Analysis by MFA @ 04-Oct-2020Demonstration & Ilustration For Analysis Tools by MFA.
Trading Style: Swing
Estimated Holding Period: 0-2 month
Checklist For Bullish Setup:~
1. Candlestick: The price has closed with a strong Bullish Candle. Yes/No?
2. MFA S&R Line: The price is still at Support Zone area. Yes/No?
3. MFA Trend Line: The price has started to break downtrend line. Yes/No?
4. MFA Bullish Indicator: The stock is still in Bullish Momentum (green). Yes/No?
Disclaimer:~
The writing purpose is for demonstration & ilustration of Analysis Tools only.


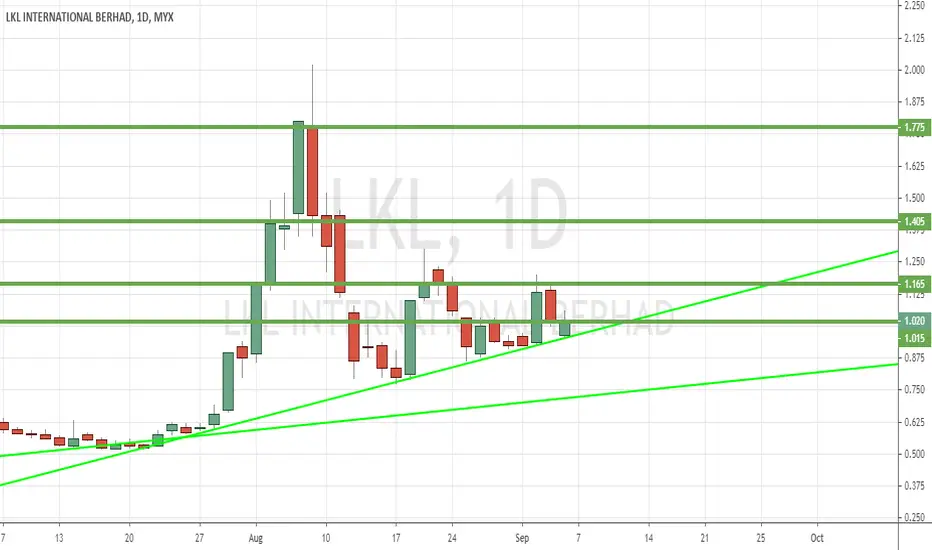
LKL INTERNATIONAL PRICE ACTION MOVEMENT FORECAST DAILYBuy after price break 1.165, first resistance 1.405, and second resistance 1.775, recommended stop loss 1.020.

LKLLKL 1 HOUR
TRIANGLE PATTERN
STILL IN CONSOLIDATE...
BUY SIGNAL 1HOUR..
CL - 0.825
TP 1 - 2.00
TRADE AT YOUR OWN RISK...

LKL trade ideaNext target price based on fibonacci extension
This counter is covid related and supplier for hospital beds
Current target price:
1.715
2.465
Overall this stock still in the bullish bias with positive volume
Mark your exit price for sell plan or set trailing stop based on lowest Q of the day
If you like this stock and profit, hit donate ;P

Training 3/8/2020 - LKL; PART 2TP today for LKL at 10% profit (1.020) before seeing LKL further closed at 1.170. Either you follow your trading plan TP all the way, or you settle at ROI 10% as per your risk calculation.
Any input @ feedback for me to improves in drawing the chart and writing down my trading plan is really appreciated. Btw, be nice please.. Thank you and have a great trading

Training 30/7/2020 - LKLAny input @ feedback for me to improves in drawing the chart and writing down my trading plan is really appreciated. Btw, be nice please.. Thank you and have a great trading


LKL Get Up ?Daily :
- in sideway structure (accumulation for a while)
- There is candle break the MA20 suggest uptrend
1H :
- the price make a momentum by break the upper BB
- then retrace to the mid BB, price for entry
Supporting point :
- in Daily chart, the price above MA20, 50 and 200
- QR for past 3Q incresing
- strong volume 16M , average volume 19M
- stoch cross up
