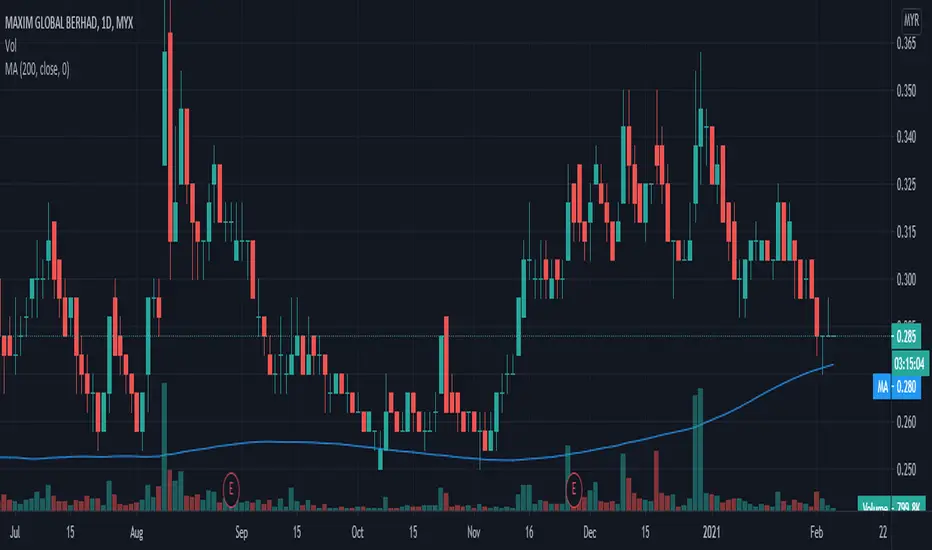
MAXIM: Property sector on the move?- Frequently volume spike
- Ascending Triangle on new platform above the base
- Volume contraction within consolidation triangle
- Nice RRR entry around previous pivot low
Disclaimer:
For discussion and sharing purpose only. NOT entry recommendation. Trade at your own risk.
#TAYOR
0.040 MYR
26.89 M MYR
329.91 M MYR
89.70 M
About MAXIM GLOBAL BERHAD
Sector
Industry
CEO
Seong Liam Gan
Website
Headquarters
Petaling Jaya
Founded
1968
ISIN
MYL4022OO009
FIGI
BBG000BPM202
Maxim Global Bhd. is an investment holding company, which engages in the real estate business and provision of management services. It operates through the following segments: Property Development, Construction & Investment, Timber, Management & Consultancy, and Others. The company was founded on December 4, 1968 and is headquartered in Petaling Jaya, Malaysia.
Related stocks


Bullish BreakoutTP: 0.46
SL: 0.25
HAPPY NEW YEAR 2021!!🎉🎉
Disclaimer: Our content is intended to be used and must be used for informational purposes only. It is very important to do your own analysis before making any investment base on your own personal circumstances. The content on this analysis is subject to c

MAXIM AnalysisPrice breakout with high volume and still above mid BB.
RSI crossing overbought region and Multiple Timeframe MACD above centerline.
Entry price: 0.315-0.325
Cut loss: 0.305
TP1: 0.340
TP2: 0.370

Maxim, let is retrace first. Never chase high. But still we have a strategy to play safe with this goreng stock.
PM me for more detail.

<TradeVSA> Tadmax to change the direction soon?Strength in the chart:
1. Pentagon with Line Change
2. Shaekout in accumulation
3. To re-test resistance again
Disclaimer
This information only serves as reference information and does not constitute a buy or sell call. Conduct your own research and assessment before deciding to buy or sell any st

<TradeVSA> Stock Update & Review - 4 September 20191. Wilmar
2. Uzma
3. Xin Hwa
4. Komark
5. Dufu
6. Power Root
7. V.S
8. Green Packet
9. FrontKen
10. KNM
11. Naim
12. MI
13. Bumi Armada
14. Smtrack
15. Sanbumi
16. Tadmax
Disclaimer
This information only serves as reference information and does not constitute a buy or sell call. Conduct your own r

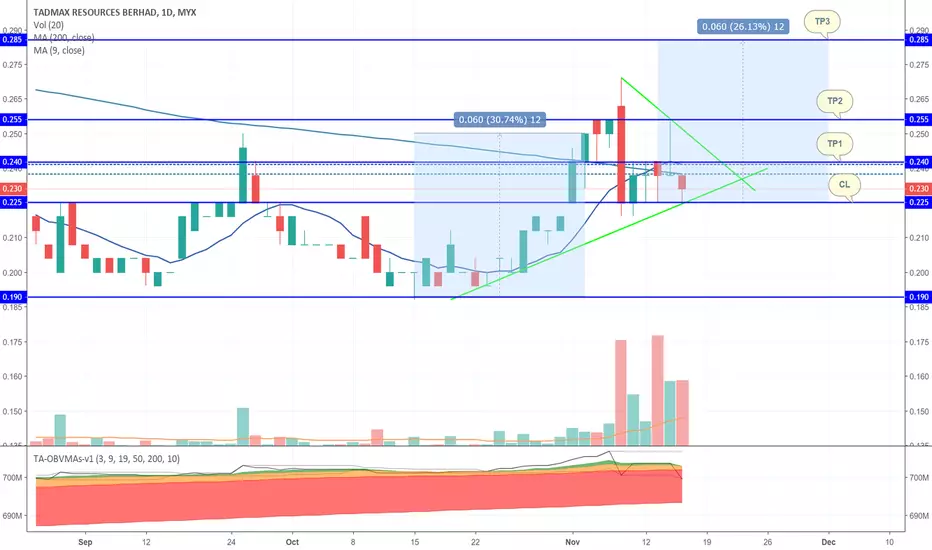
Tadmax ke arah Max?1. Cubaan utk short term downtrend reversal telah berjaya, MA9 cross MA200.
2. Chart pattern menunjuk kemungkinan untuk meloncat ke TP2 0.28.
3. HHHL support di 0.225, juga adalah CL BB, sebagai CL.
4. RR MT Risk 0.23-->0.225, Reward 0.23 -->0.285, Risk reward mid term 1:10.
5. RR ST Reward 0.23 -->
See all ideas
Summarizing what the indicators are suggesting.
Oscillators
Neutral
SellBuy
Strong sellStrong buy
Strong sellSellNeutralBuyStrong buy
Oscillators
Neutral
SellBuy
Strong sellStrong buy
Strong sellSellNeutralBuyStrong buy
Summary
Neutral
SellBuy
Strong sellStrong buy
Strong sellSellNeutralBuyStrong buy
Summary
Neutral
SellBuy
Strong sellStrong buy
Strong sellSellNeutralBuyStrong buy
Summary
Neutral
SellBuy
Strong sellStrong buy
Strong sellSellNeutralBuyStrong buy
Moving Averages
Neutral
SellBuy
Strong sellStrong buy
Strong sellSellNeutralBuyStrong buy
Moving Averages
Neutral
SellBuy
Strong sellStrong buy
Strong sellSellNeutralBuyStrong buy
Displays a symbol's price movements over previous years to identify recurring trends.
Frequently Asked Questions
The current price of MAXIM is 0.385 MYR — it has increased by 2.70% in the past 24 hours. Watch MAXIM GLOBAL BERHAD stock price performance more closely on the chart.
Depending on the exchange, the stock ticker may vary. For instance, on MYX exchange MAXIM GLOBAL BERHAD stocks are traded under the ticker MAXIM.
MAXIM stock has risen by 2.70% compared to the previous week, the month change is a 8.57% rise, over the last year MAXIM GLOBAL BERHAD has showed a −11.49% decrease.
MAXIM reached its all-time high on Jul 31, 2007 with the price of 3.415 MYR, and its all-time low was 0.240 MYR and was reached on Mar 17, 2020. View more price dynamics on MAXIM chart.
See other stocks reaching their highest and lowest prices.
See other stocks reaching their highest and lowest prices.
MAXIM stock is 1.30% volatile and has beta coefficient of −0.98. Track MAXIM GLOBAL BERHAD stock price on the chart and check out the list of the most volatile stocks — is MAXIM GLOBAL BERHAD there?
Today MAXIM GLOBAL BERHAD has the market capitalization of 279.31 M, it has increased by 2.70% over the last week.
Yes, you can track MAXIM GLOBAL BERHAD financials in yearly and quarterly reports right on TradingView.
MAXIM net income for the last quarter is 9.63 M MYR, while the quarter before that showed 7.36 M MYR of net income which accounts for 30.82% change. Track more MAXIM GLOBAL BERHAD financial stats to get the full picture.
MAXIM GLOBAL BERHAD dividend yield was 0.00% in 2024, and payout ratio reached 0.00%. The year before the numbers were 8.00% and 400.00% correspondingly. See high-dividend stocks and find more opportunities for your portfolio.
EBITDA measures a company's operating performance, its growth signifies an improvement in the efficiency of a company. MAXIM GLOBAL BERHAD EBITDA is 61.64 M MYR, and current EBITDA margin is 14.76%. See more stats in MAXIM GLOBAL BERHAD financial statements.
Like other stocks, MAXIM shares are traded on stock exchanges, e.g. Nasdaq, Nyse, Euronext, and the easiest way to buy them is through an online stock broker. To do this, you need to open an account and follow a broker's procedures, then start trading. You can trade MAXIM GLOBAL BERHAD stock right from TradingView charts — choose your broker and connect to your account.
Investing in stocks requires a comprehensive research: you should carefully study all the available data, e.g. company's financials, related news, and its technical analysis. So MAXIM GLOBAL BERHAD technincal analysis shows the buy rating today, and its 1 week rating is buy. Since market conditions are prone to changes, it's worth looking a bit further into the future — according to the 1 month rating MAXIM GLOBAL BERHAD stock shows the neutral signal. See more of MAXIM GLOBAL BERHAD technicals for a more comprehensive analysis.
If you're still not sure, try looking for inspiration in our curated watchlists.
If you're still not sure, try looking for inspiration in our curated watchlists.