MCLEAN- Retracement halted at golden zone 61.8% fibo level.
- Waiting to breakout falling wedge/ sideways.
R1: 0.435
R2: 0.505
R3: 0.585
S: 0.375
MCLEAN trade ideas

MCLEAN harga diskaun pada SUPPORTMCLEAN break wave 2 pada SUPPORT FIBO price 0.380 adakah mampu meneruskan wave 3 #TAYOR #MCLEAN

MCLEANTrade ideas for this counter.
CL if price go down below Red line.
otherwise, hold until TP
Happy trading
TAYOR

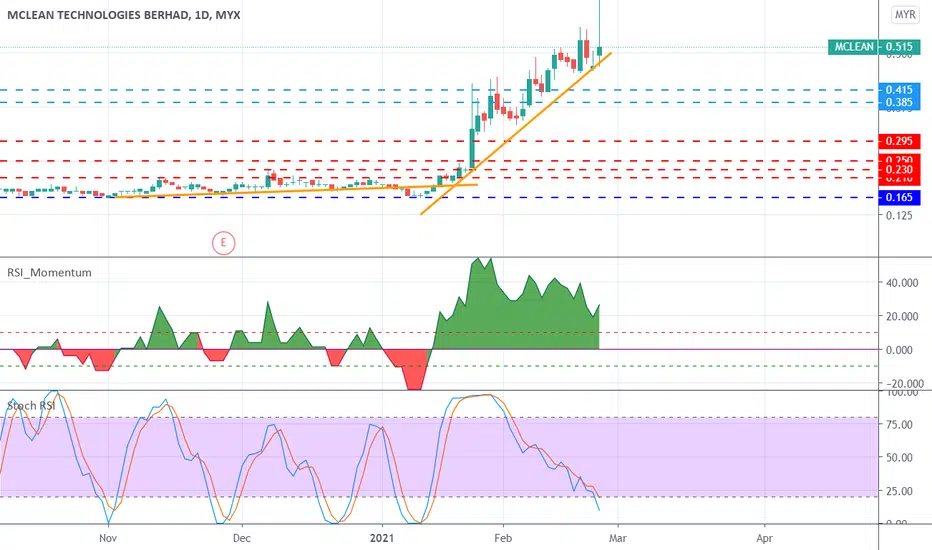
MCLEAN - will Continue uptrendingBased on the current Candle, Seller was winning and with quite a bigger selling force, but it might be due to external news/sentiment
Stoch-RSI currently at Oversold which is good sign that the price still have possibility to go up with the RSI momentum still above zero and showing good strength, there might be small correction or sideway before it will continue going strong upwards.
MCLEAN - Uptrend continue?Last - 0.555
To confirm uptrend pattern:
If bullish candlestick continue next Monday (1/3/21) - closed above support 0.545.
Resistance #1 - 0.635
Resistance #2 - 0.730
Will have highest price if break Resistance #2.
#Newbie
#NotBuyCall
#EducationalPurpose

MCLEAN - Ideas updateNote
- This stock made good movement even its only rally during end of market close for CNY. It has reach a new 52 weeks high for this week.
- Base on Trendband chart, we spot the direction line (purple) is above green plot background. As I added two more EMAs line (100 & 200) and added comparison with Tech sector to compile my prediction toward this counter, its shows a positively the price will ongoing forward incline impulsively after few correction has been made.
- Suggest point of entry shall be in between Resistance line & new support line in next coming swing. SL will be not more than 11%.


McLean making dark cloud pattern Dark cloud condition
1) must be in uptrend condition
2) make a bullish candle
3) next day make gap up
4) make a bearish candle
5) Close price is below 50% from previous candle

MCLEAN - COMMERCIAL SERVICES- kaunter yang pernah menjadi kebanggaan suatu ketika dahulu
- mampukah membuat kenaikan selepas kejatuhan mendadak
- kita lihat dlm masa seminggu dari sekarang


MCLEAN - MSRS : 185
R1 : 210
R2 : 230
RSI : 45
Number of Share: 197.21m
Sector : Industrial Products & Services

EASY123 Prediction @MYX MCLEANLife is simple...Trade with Simplicity!
*The Trend direction: UPTREND - as Higher-High & Higher Low was observed (Green background region).
*The price has break-up and stand above our lifeline (Redline) on 27-Apr.
*Bottom signal (Green-upward triangle) was sighted on 19-Mar.
*Turning points (Purple-candle) have appeared on 27-Mar & 24-Apr, an indication of the price revert to upward direction.
*The accelerate signal (White-Diamond) was sighted on 25-Mar & 24-Apr, an indication of the strong buying momentum.
*A Yellow-candle + Alert Bell has appeared on 27-Apr, an indication of price potentially take-off.
Prediction: The current price was pullback and supported by our lifeline (Redline) region after it breakup on 27-Apr.
Once it breaks this immediate resistance R0.225 it will take-off to the next level.
*Otherwise, it will hover sideways within a range between 0.225 - 0.16
Preference Strategy: Swing trading (Follow the BUY/SELL Signal respectively).
Target Price: R1=0.26-30 & R2=0.33-38
Support/Cut Loss: S1=0.15
*Reminder TP & CL is an individual preference & decision. No fixed rule or guideline for it...Trade at your own risk.
Signal's Interpretation:
BUY Signal:-
*Green-Background = Indication of an Uptrend
*BT-Yellow-Diamond = Indication of Bottom signal.
*Green-Upward-Triangle = Indication of Hot-seller, potentially a Bottom signal.
*White-Diamond = Indication of a strong upward momentum accelerator.
*Purple-Candle = Indication of a strong turning point or a trend reversal.
*Yellow-Candle + Alert-Bell = Indication of Price take-off area.
SELL Signal:-
*Red-Background = Indication of a Downtrend.
*Red-Dot = Indication of Hot-buyer, potentially a Top signal.
*Blue-Candle = Indication of Price selling off area.


MCLEAN: PULLBACK OR BREAKOUT?The momentum and RSI are on overbought territory. Wish side do you choose? Retracement or Breakout? Feel free to comments.

{SWC}——MCLEAN, Volume Triggered
Strategy: PVA
Bias: Bullish.
Traded earlier with private and public group members at low since RM0.170. Congrats everyone who followed and profited :)
Yesterday, strong reversal from RM0.190 and formed bullish engulfing. Discussed in private message with private group member regarding this potential reversal exactly one day earlier :)
Gap up with volume, next to potentially challenge further neckline at RM0.270 provided momentum sustained.
Kindly take note that Chinese New Year is coming and the market would have less involvement by market participants.
S: 0.230, 0.210
R: 0.270
If you found this idea helpful, do not hesitate to drop us a like and comment! :)

<TradeVSA> Support still strong in McleanStrength in the chart:
1. Spring as support
2. Downbar with low volume
Hit the "LIKE" button to support us :)
Disclaimer
This information only serves as reference information and does not constitute a buy or sell call. Conduct your own research and assessment before deciding to buy or sell any stock
