MFLOURAlgo TradingSystem by Remisier CheDin
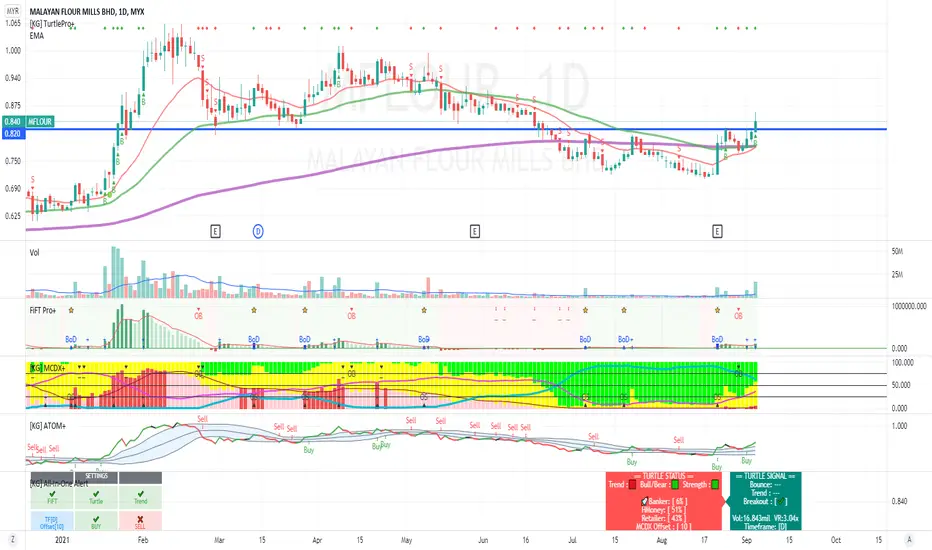
The current market conditions, as identified by my algorithmic system, indicate potential upward signals. These signals include increased trading volume, an upward trend with prices above the EMA20 and EMA50. Consequently, the present conditions suggest a possible upward trend.
It's crucial to remember that trading strategies account for only 10-20% of your overall trading success. The majority of your success depends on effective risk management. This involves having a well-defined trading plan and appropriate position sizing, which are essential for maintaining the right trading psychology. Master your risk management and trade according to your plan.
MFLOUR trade ideas


Accumulation Pattern!The price candlestick indicates an accumulation pattern where the price moves in a sideways range for an extended period before attempting to break out the upper line of the price channel. With the result in volume exceeded the MA line.
MACD and RSI indicators indicate a positive momentum and are aligned with the price candlestick.
Let's save MFLOUR in WL and watch out for significant price movement action with results in volume exceeding the MA line.
R 0.700
S 0.620, 0.600


Mflour look like gonna fly soon.!!!!!!!Upward trend, will hit RM1 soon
Will be another uptrend if BO (Down Upper Trend Line)

MFLOUR VCP (Follow Up)MFLOUR I first share on 13th Jan seeing this stock entering stage 2 with huge volume since end 2022. Then i shared on 30th Jan on observing short base VCP setup. (link on previous 2 articles in below)
The VCP base continue to develop and recently pull back deep to form a C2.
It might form another C3 before take off. (Based on VCP experience so far)
Keep an eye on this. Might be the next gem after PANTECH, PPHB, SLVEST.

MFLOUR Short Base VCP (Follow Up)MFLOUR I shared on 13 Jan and updated the progress in the earlier post. Short based VCP observed!
C1: 14%
C2: -6%
C3: -3%
Might have another round of contraction or might breakout and pull back. Depend on how the fund operators want to execute.
Let's wait and see.
Disclaimer:
Information presented here is not intended to be used as the sole basis of any investment decisions nor should it be construed as advice designed to meet the investment need of any investor. Trade at your own risk.

MFLOUR entering STAGE 2MFLOUR i traded back then in Jan 2021. Exact date will be 18 Jan 2021 when the chart setting up VCP. The trade went pretty good profit ~30%+
The chart after that went to Stage 4 downtrend since Feb 2021 till Nov 2022 (which is 600 days+). During this period of time, it is not appearing in the screener at all.
End Nov 2022, volume and price both kick in and the chart currently back to Stage 2.
Recently, this stock keep pop up in my screener. Is time to monitor this stock if VCP will set up again. Will keep update this stock if there is any movement.
If anyone got any questions, feel free to comment.
Disclaimer:
Information presented here is not intended to be used as the sole basis of any investment decisions nor should it be construed as advice designed to meet the investment need of any investor. Trade at your own risk.

Will the Shakeout Completed with Change of TrendSign of Strength in the chart:
1. Accumulation stage
2. Shakeout Pattern
Disclaimer
This information only serves as reference information and does not constitute a buy or sell call. Conduct your own research and assessment before deciding to buy or sell any stock

Mflour - break upMflour - break up done, Up trend may continue
VT Stock indicator is a stock breakout trend indicator for identifying the change of Mid to long term trend direction
(Disclaimer: for demonstrating own planned trade records study only and education purpose, not for recommend to buy or sell. Trade at your own risk)

Mflour done retest? continue to climb in next few days or weeks?Slow turtle buy on breakout long term trend line
Fift+ve
Mcdx+ almost 0 retailers
Atom swim above river
TP 0.725
MYX:MFLOUR

The end of wave 4?Hidden divergence can be seen. Could be suggesting a reversal trend is coming. Take MA50 as entry point or support. TAYOR.

MFLOUR on recovery UPPrice has broken above a double bottom back in Jan 2021, and price has throwback to the BO line with decreasing volume, culminating with a false breakdown. MFLOUR is currently at the BO retracement price level indicating a good value for potential upside. Although this double bottom BO with strong price and volume, however the BO came amid long and slow build up - not aggressive. Think back, MFLOUR had been in talk with Tyson which explains the slow and steady accumulation.
MFLOUR is on track to hit the MYR1.25 projection. News was out, traders reacted, and now is the time for disposal payment and synergy to work the way up. At the current price of MYR0.785, this represents a potential upside of 59%.
Issue - The question is not would MFLOUR hit MYR1.25, the question is when. Will it takes longer than your patience?
Mindful that this disposal payment is dependent on performance, hence it is crucial for MFLOUR to perform well. This motivation should answer the question of time.
Be careful of overhead speed bumps on its way up.

Re-Bounce Pattern!The Fibonacci chart (FIBO) indicates MFLOUR is in a re-bounce pattern where it will test resistance at 0.86. MA20 likely will be cross up EMA50 when buying interest is high and have a significant price movement with volume to support the price increase. MA20 and OBV chart confirmed MFLOUR is in an uptrend pattern.
R 0.86
S 0.79

MFLOUR Turtle BOB Type 1 StrategyMYX:MFLOUR
Slow Turtle Buy
FiFT +ve (Bull recharge)
Atom Above River
Banker 6%

MFLOUR - Pre Consolidation BreakoutPre Consolidation Breakout Setup.
NO INVESTMENT ADVICE IS PROVIDED
DISCLAIMER
Please consider your own interpretation of Opportunity & Risk. The author of this post strictly follows the Malaysian Security Commission ( SC ) Guidelines on the prohibition of Investment Advice by unlicensed parties. Any examples shall use historical charts without any recommendations and not to cause inducement to the public to take action or position (e.g. buy, sell or hold) regarding a particular class, sector, or instrument in relation to securities or derivatives. The author will never provide any investment or trading advice as the activity of giving investment advice is likely to be considered as a regulated activity under the Capital Markets and Services Act 2007 ( CMSA ). All posts made in Tradingview do not include any communications involving providing recommendations or opinions or includes any material, content or any statement which are likely to induce a person to take any action or position (e.g. buy, sell or hold) regarding a particular class, sector, or instrument in relation to securities or derivatives that is likely to be considered as “advising others concerning securities or derivatives”. The author will not recklessly make any statement, promise or forecast that is misleading, false or deceptive to induce or attempt to induce another person to deal in securities or derivatives. None of information posted in post can be used as investment decisions. Do not trade solely on the information posted. Trade at your own risk and judgement. A trader could potentially lose all money. Only risk capital that can be lost without jeopardizing ones financial security of lifestyle. Please seek licensed professional guidance if you plan to invest your capital seriously.


MFOURTrade ideas for this counter.
Wait for signal candle - hammer/inverted hammer at this green zone before decide for buying opportunity.
There are 3 triple top that price try to break but failed.
Happy Trading.
TAYOR

MFLOUR VCP DEVELOPMENTMFLOUR coming to the last contraction of VCP development after 160 days.
C1: ~25%
C2: ~12%
C3: ~14%
C4: ~9%
C5: ~4%
As you can see the volume spike during price spike and volume reduce when price retrace.
Awaiting volume again to attack. And with current supply is so dry, easily will spike up high.
Immediate support: 0.650 (6% risk)
Disclaimer: Sharing chart pattern purpose, not a buy call post. Trade at own risk.

MFLOUR BTST/INTRADAY 22/1/2020 IDEA#IDEA BELI DAN JUAL.
#SETUP
#BTST
#INTRADAY
#JAGA CL
#KAJIAN
#RUJUK CHART
#10.30am TAK GERAK JUAL
#TP SEBELUM MARKET CLOSE
#TAYOR

MFLOUR -STRONG MYRUSD WILL ADD VALUE TO MAJOR IMPORT COUNTERStrong ringgit will impact low import cost for MFLOUR. Comparing 2 chart between MFLOUR and MYRUSD show parallel trend. Eyes on for this counter.

MFLOURMaintain in an uptrend channel
Collection area 610-645
Cl below 600 (break uptrend)
Looking forward to increasing demand for flour due to MCO
Long term prospect
