N2N trade ideas

Less active stock. Propose to monitorLess active stock. it require close monitor if the smart money come in. FA is good and accept

N2N Short Base VCP SetupN2N just entered into Stage 2 (Up trend Stage) and observed to develop a short based VCP.
C1: 16%
C2: 4%
C3: 3%
Currently forming a pivot point. Take note that 11 June will be the dividend entitlement date. Lets see how the price develop after the that.
Fundamental and prospect wise, N2N is looking good.
Disclaimer:
The content provided is my personal experience sharing through technical and fundamental analysis point of view. The content can only be used for education purposes and NOT any recommendation for buying or selling stock. Please ask your remiser/dealer for making decision. Trade at Your Own Risk.

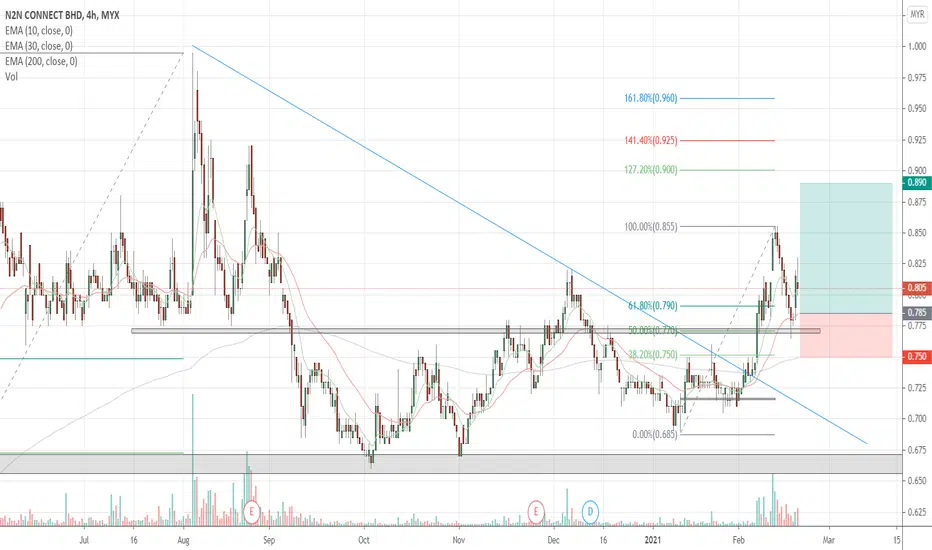
N2N - Triangle Formation BreakoutInverted hammer in late April marks the start of a triangle formation as prices continue to fluctuate. Connecting the lower highs and higher lows, we see a breakout but with no strong volume.
Good risk-reward by setting 50% Fibonacci retracement level as support. Targeting MYX:N2N to retest prior high in the near term for a quick 10% gain. The 85.5sen price level should be critical for further movements.
Total Turnover Moving Average (TTMA) now coincides with the 0.236 Fibonacci retracement level. With the recent market interest, trading volume approximates a turnover of all floating shares available in the market, raising 'market average prices' from 72sen to 77sen. For more information about TTMA, please refer to the openly published scripts.
Feel free to comment to discuss about the usefulness of this variable trend indictor.
Theme: Technology

N2N Chart updated 8 May 2021Price may found support at zone, trending up to strong resistance zone @ around Rm1.400

FIBONACCHI TREND STRATEGYCurrently on an upward trajectory with strong momentum, just touched fibo 38.2% and retraced due to profit takeing, will continue climbing towards competion major wave 3 EW


Trend Rider 271. Weekly starting to make an uptrend. EMA 10 > EMA 30 but below EMA 200. Also starting to make Wave 3.
2. H4, price broke the downtrend line and retrace to 0.5 Fibonacci level also RBS. Doji formed and followed by a strong bullish candle potentially to form Wave 3.
3. Isaham rating 11.4 PE 21.9 WAFV RM0.99, i3 ATP RM1.01.

N2N ready for a breakoutChart pattern is forming a triangle, entering a squeeze.
Expecting it will challenging previous new high, around RM 0.90 (+20%)
Risk reward ratio = 2.8
CL = -7%
Like my works? Please hit the Like, Follow and Share :)
Thanks!
Disclaimer
This information only serves as study references, does not constitute a buy or sell call.

Awaken BullN2N approaching Fibonacci target 1.618 at 1.39, exit below 0.63
Disclaimer: The content on this analysis is subject to change at any time without notice, and is provided for the sole purpose of assisting traders to make independent investment decisions.

N2N - Heading to 1.03?#N2N
Rst: 0.96
Spp: 0.865
Bullish breakout with substantial buying interest flown in, continue to stay above Fibo Ext 50% will keep this momentum bull.

N2N Long Term TradeDaily chart Fast Turtle BUY above 0.835 (Partial Buy).
Weekly Fast Turtle Buy trigger if close above 0.84
Further Buy above 0.85
Slow Turtle Breakout above 0.905
FiFT +ve
ATOM BUY
Volume Built-up possible Rounding Bottom pattern in the making.
TP 0.99, 1.1, 1.3
SL 0.75


N2N CONNECTTrade ideas for this counter.
Remain neutral as long as price doesn't breakout resistant line
Below is hidden base aka swap base which price still hasn't retest.

Stock to Watch Symmetrical Triangle Pattern spotted. Wait for BO of descending trendline with more average volume.
Quarterly profit, EPS growing for 2 consecutive quarter.


#8 N2N BOD+3M+SNRFUNDAMENTAL ANALYSIS
Sector: Technology
Subsector: Software
Business: Trading platform software
FA not good
TECHNICAL ANALYSIS
Chart retracing
MA50 overtake MA200 -- lagging bullish indicator
MA20 touch green candle -- GOOD
Stoch RSI uptrend 19%, K&D crossing
BOD on 24 June 2020
No. of shares: 597.88m -- Quite volatile
EP: 830
TP: 900
CL: 765
RRR: 1.08 -- Position sizing small


PERMULAAN KENAIKAN ?1) menarik untuk di perhatikan,
2) membentuk corak seakan-akan "double bottom"
3) lebih menarik kerana candle stick pinbar beserta volume yang besar.
4) reward yang berbaloi JIKA analisa menjadi.
Penafian : hanya sekadar pembelajaran. risiko pembelian atas risiko sendiri


