OCNCASH : Filter 3 appearedFilter 3 combines the conditions of both Filter 1 and Filter 2. It requires that both Filter 1 and Filter 2 generate signals simultaneously. When this happens, it indicates a strong breakout signal with price and volume confirming the upward momentum.
The Marubozu candle closed at 0.34 (strong resi
Next report date
—
Report period
—
EPS estimate
—
Revenue estimate
—
−0.005 MYR
−259.02 K MYR
76.15 M MYR
223.52 M
About OCEANCASH PACIFIC BHD
Sector
Industry
CEO
Wey Chien Tan
Website
Headquarters
Bandar Baru Bangi
Founded
1997
ISIN
MYQ0049OO005
FIGI
BBG000Q36Q73
Oceancash Pacific Bhd. is an investment holding company, which engages in the provision of management services to its subsidiaries. It operates through the following business segments: Insulation, Hygiene, and Investment Holding. The Insulation segment manufactures and distributes insulation products. The Hygiene segment involves in manufacturing and trading of hygiene products. The Investment Holding segment provides investment holding and management services. The company was founded by Siew Chin Tan and Pong Kiat Lo in 1997 and is headquartered in Bandar Baru Bang, Malaysia.
Related stocks


OCNCASH-Stochastic OversoldAnalysis:
Stochastic Oversold, Need to break Down Trendline to go up, Next resistant 0.725

OCNCASH - Consolidation Leading TL Break (Short Term Bullish)
Please consider your own interpretation of Opportunity & Risk:
Opportunity to buy into weakness, approaching area of support.
NO BUY CALLS OR INVESTMENT ADVISED ARE PROVIDED.
DISCLAIMER: This analysis is for reference and learning purposes only. It is based on my personal view in the market

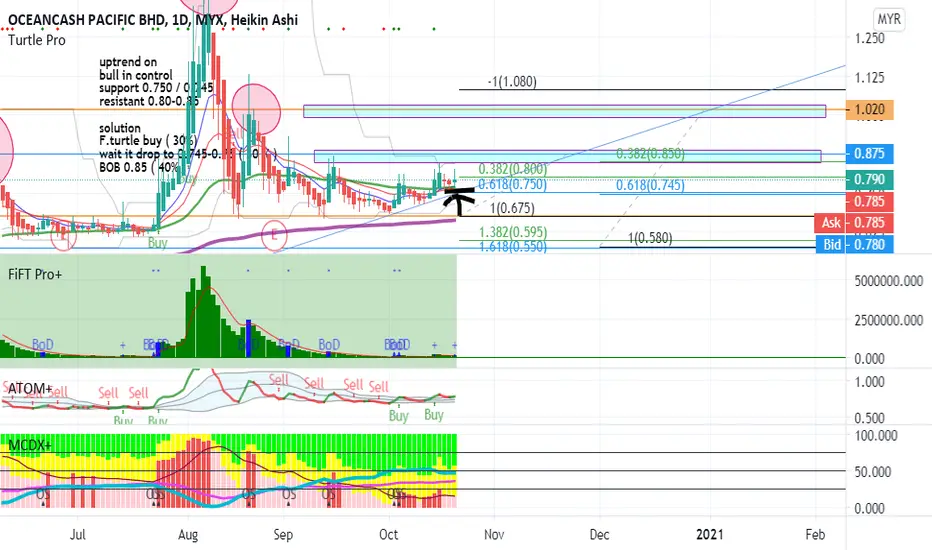
F.turtle buy ( 30%) 0.745-0.75 ( 30 % ) BOB 0.85 ( 40%)uptrend on
bull in control
support 0.750 / 0.745
resistant 0.80-0.85
solution
F.turtle buy ( 30%)
wait it drop to 0.745-0.75 ( 30 % )
BOB 0.85 ( 40% )
OCNCASH - BREAKOUT DOWNTRENDLooking at the chart, OCNCASH in an attempt to break downtrend line signaling for reversal. All its peers are already moving higher for few days. Will OCNCASH follow the same trending as per the other healthcare provider?
Current price at 0.810
Support at 0.720, or tighter at 0.76
Next resistance a

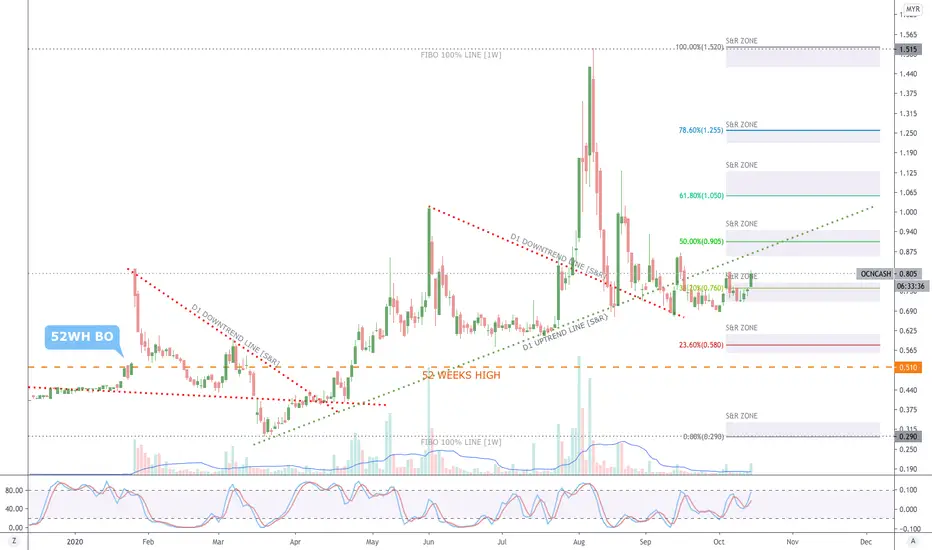
OCNCASH [14 October 2020] Buy On Resistant Zone Break OutMYX:OCNCASH
Breakout Downtrend Line
52 Weeks High Line
Fibbonaci Retracement
Candlestick Support & Resistant Zone
Trendline Support & Resistant
Ocn cash can view it divergent with buy signal down trend at this moment
stoch is divergent\
wait BOD signal and Fast turtle buy

OCNCASH - Towards 100% Symmetry Projection & Fib. Ext to -61.8%Strong Volume Up With Risk of Correction
Opportunity & Risk:
Green Arrow (Transparency = 0) = Representing Opportunity
Red Arrow (Transparency = 0) = Representing Risk
Green Arrow (Transparency = 30%) = Representing Alternate View for Opportunity, or less probable outcomes
Red Arrow (Transparency

OCNCASH - Pending Completion of Rounding Bottom#OCNCASH
Rst: 1.03
Spp: 0.86
Doji candlestick emerged above upper BB, afternoon pull back was quick being supported by strong buying pressure, both RSI and MACD in bullish mode. Further upside observable.

See all ideas
Summarizing what the indicators are suggesting.
Oscillators
Neutral
SellBuy
Strong sellStrong buy
Strong sellSellNeutralBuyStrong buy
Oscillators
Neutral
SellBuy
Strong sellStrong buy
Strong sellSellNeutralBuyStrong buy
Summary
Neutral
SellBuy
Strong sellStrong buy
Strong sellSellNeutralBuyStrong buy
Summary
Neutral
SellBuy
Strong sellStrong buy
Strong sellSellNeutralBuyStrong buy
Summary
Neutral
SellBuy
Strong sellStrong buy
Strong sellSellNeutralBuyStrong buy
Moving Averages
Neutral
SellBuy
Strong sellStrong buy
Strong sellSellNeutralBuyStrong buy
Moving Averages
Neutral
SellBuy
Strong sellStrong buy
Strong sellSellNeutralBuyStrong buy
Displays a symbol's price movements over previous years to identify recurring trends.
Frequently Asked Questions
The current price of OCNCASH is 0.225 MYR — it has decreased by −2.17% in the past 24 hours. Watch OCEANCASH PACIFIC BHD stock price performance more closely on the chart.
Depending on the exchange, the stock ticker may vary. For instance, on MYX exchange OCEANCASH PACIFIC BHD stocks are traded under the ticker OCNCASH.
OCNCASH stock has fallen by −2.17% compared to the previous week, the month change is a −10.00% fall, over the last year OCEANCASH PACIFIC BHD has showed a −38.36% decrease.
OCNCASH reached its all-time high on Aug 7, 2020 with the price of 1.520 MYR, and its all-time low was 0.010 MYR and was reached on Jan 28, 2008. View more price dynamics on OCNCASH chart.
See other stocks reaching their highest and lowest prices.
See other stocks reaching their highest and lowest prices.
OCNCASH stock is 13.64% volatile and has beta coefficient of −0.94. Track OCEANCASH PACIFIC BHD stock price on the chart and check out the list of the most volatile stocks — is OCEANCASH PACIFIC BHD there?
Today OCEANCASH PACIFIC BHD has the market capitalization of 58.68 M, it has increased by 2.22% over the last week.
Yes, you can track OCEANCASH PACIFIC BHD financials in yearly and quarterly reports right on TradingView.
OCEANCASH PACIFIC BHD is going to release the next earnings report on Sep 1, 2025. Keep track of upcoming events with our Earnings Calendar.
OCNCASH net income for the last quarter is −284.00 K MYR, while the quarter before that showed −1.99 M MYR of net income which accounts for 85.70% change. Track more OCEANCASH PACIFIC BHD financial stats to get the full picture.
As of Aug 10, 2025, the company has 217 employees. See our rating of the largest employees — is OCEANCASH PACIFIC BHD on this list?
EBITDA measures a company's operating performance, its growth signifies an improvement in the efficiency of a company. OCEANCASH PACIFIC BHD EBITDA is 9.35 M MYR, and current EBITDA margin is 13.79%. See more stats in OCEANCASH PACIFIC BHD financial statements.
Like other stocks, OCNCASH shares are traded on stock exchanges, e.g. Nasdaq, Nyse, Euronext, and the easiest way to buy them is through an online stock broker. To do this, you need to open an account and follow a broker's procedures, then start trading. You can trade OCEANCASH PACIFIC BHD stock right from TradingView charts — choose your broker and connect to your account.
Investing in stocks requires a comprehensive research: you should carefully study all the available data, e.g. company's financials, related news, and its technical analysis. So OCEANCASH PACIFIC BHD technincal analysis shows the sell today, and its 1 week rating is sell. Since market conditions are prone to changes, it's worth looking a bit further into the future — according to the 1 month rating OCEANCASH PACIFIC BHD stock shows the strong sell signal. See more of OCEANCASH PACIFIC BHD technicals for a more comprehensive analysis.
If you're still not sure, try looking for inspiration in our curated watchlists.
If you're still not sure, try looking for inspiration in our curated watchlists.