OCNCASH : Filter 3 appearedFilter 3 combines the conditions of both Filter 1 and Filter 2. It requires that both Filter 1 and Filter 2 generate signals simultaneously. When this happens, it indicates a strong breakout signal with price and volume confirming the upward momentum.
The Marubozu candle closed at 0.34 (strong resistance, referring to Gann chart). If breaks, it will be more likely to create new higher high. TAYOR
OCNCASH trade ideas


OCNCASH-Stochastic OversoldAnalysis:
Stochastic Oversold, Need to break Down Trendline to go up, Next resistant 0.725

OCNCASH - Consolidation Leading TL Break (Short Term Bullish)
Please consider your own interpretation of Opportunity & Risk:
Opportunity to buy into weakness, approaching area of support.
NO BUY CALLS OR INVESTMENT ADVISED ARE PROVIDED.
DISCLAIMER: This analysis is for reference and learning purposes only. It is based on my personal view in the market from a technical analysis standpoint. None of information posted in this chart can be used as investment decisions or investment advises to any parties. Do not trade solely on the information posted in this page. Trade at your own risk and judgement. A trader could potentially lose all money. Only risk capital that can be lost without jeopardizing ones financial security of lifestyle. Please seek licensed professional guidance if you plan to invest your capital seriously.
PENAFIAN: Analysis ini hanyalah untuk tujuan rujukkan dan pembelajaran sahaja dan bukan cadangan untuk membeli atau menjual stok atau apa jua jenis instrumen kewangan. Anda dinasihatkan untuk menghubungi remieser / dealer / bank pelaburan yang mempunyai lesen atau kelayakan yang sah untuk bertanyakan pendapat dan menguruskan pelaburan anda. Pelaburan dan perdagangan mempunyai risiko tinggi, dan ianya adalah Risiko Anda Sendiri.

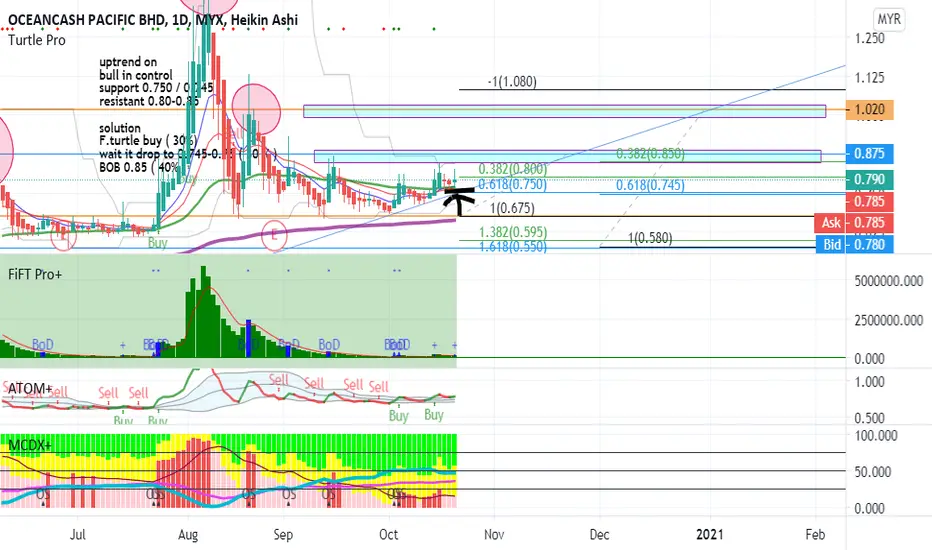
F.turtle buy ( 30%) 0.745-0.75 ( 30 % ) BOB 0.85 ( 40%)uptrend on
bull in control
support 0.750 / 0.745
resistant 0.80-0.85
solution
F.turtle buy ( 30%)
wait it drop to 0.745-0.75 ( 30 % )
BOB 0.85 ( 40% )
OCNCASH - BREAKOUT DOWNTRENDLooking at the chart, OCNCASH in an attempt to break downtrend line signaling for reversal. All its peers are already moving higher for few days. Will OCNCASH follow the same trending as per the other healthcare provider?
Current price at 0.810
Support at 0.720, or tighter at 0.76
Next resistance at 0.855

OCNCASH [14 October 2020] Buy On Resistant Zone Break OutMYX:OCNCASH
Breakout Downtrend Line
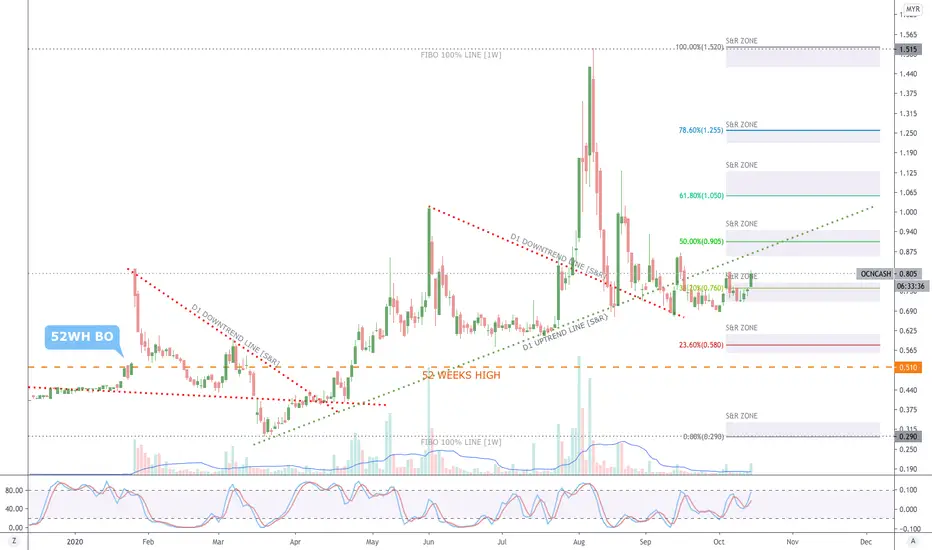
52 Weeks High Line
Fibbonaci Retracement
Candlestick Support & Resistant Zone
Trendline Support & Resistant
Ocn cash can view it divergent with buy signal down trend at this moment
stoch is divergent\
wait BOD signal and Fast turtle buy

OCNCASH - Towards 100% Symmetry Projection & Fib. Ext to -61.8%Strong Volume Up With Risk of Correction
Opportunity & Risk:
Green Arrow (Transparency = 0) = Representing Opportunity
Red Arrow (Transparency = 0) = Representing Risk
Green Arrow (Transparency = 30%) = Representing Alternate View for Opportunity, or less probable outcomes
Red Arrow (Transparency = 30%) = Representing Alternate View for Risk, or less probable outcomes
NO BUY CALLS OR INVESTMENT ADVISED ARE PROVIDED.
DISCLAIMER: This analysis is for educational and informational purposes only. It is based on my personal view in the market from a technical standpoint. None of information posted in this page can be used as investment decisions except for educational purpose only. Do not trade solely on the information posted in this page. Trade at your own risk and judgement. A trader could potentially lose all money. Only risk capital that can be lost without jeopardizing ones financial security of lifestyle. Please seek licensed professional guidance if you plan to invest your capital seriously.
PENAFIAN: Analysis ini hanyalah untuk tujuan pembelajaran & pendidikan sahaja dan bukan cadangan untuk membeli atau menjual stok atau apa jua jenis instrumen kewangan. Anda dinasihatkan untuk menghubungi remieser / dealer / bank pelaburan yang mempunyai lesen atau kelayakan yang sah untuk bertanyakan pendapat dan menguruskan pelaburan anda. Pelaburan dan perdagangan mempunyai risiko tinggi, dan ianya adalah Risiko Anda Sendiri.

OCNCASH - Pending Completion of Rounding Bottom#OCNCASH
Rst: 1.03
Spp: 0.86
Doji candlestick emerged above upper BB, afternoon pull back was quick being supported by strong buying pressure, both RSI and MACD in bullish mode. Further upside observable.

OCNCASH - Inverted Hammer At Area of Support (High Value Area)Opportunity and Risk
DISCLAIMER: This technical analysis is for educational and informational purposes only. It is based on my personal view of the market from a technical standpoint. None of information posted in this page can be used as investment decisions except for educational purpose only. Do not trade solely on the information posted in this page. Trade at your own risk and judgement. A trader could potentially lose all money. Only risk capital that can be lost without jeopardizing ones financial security of lifestyle. Please seek licensed professional guidance if you plan to invest your capital seriously.
PENAFIAN: Analisis Teknikal ini hanyalah untuk tujuan pembelajaran & pendidikan sahaja dan bukan cadangan untuk membeli atau menjual stok atau apa jua jenis instrumen kewangan. Anda dinasihatkan untuk menghubungi remieser / dealer / bank pelaburan yang mempunyai lesen atau kelayakan yang sah untuk bertanyakan pendapat dan menguruskan pelaburan anda. Pelaburan dan perdagangan mempunyai risiko tinggi, dan ianya adalah Risiko Anda Sendiri.


OCNCASH - How to detect buyer moves using this simple method. Example only. I called it 3 drive.
1st look at the left and mark on the price. In this case price accumulation before going up. Then price start to retrace with small candle. At this moment, detect with your eyes and marking every shadow that you see as example - arrow.. At last or 3rd shadow, price start to rebound upwards and now uptrend probably resume. (only 3 shadow need for this method).
U can also add MACD as your reference and see a divergent here.. so try and train your eyes if you see this type of pattern. No funky munky complicated method here. I juz use naked chart.. This is the best method.Believe me.
Update: price move upwards and now retrace at the first move. Higher high - higher low.. So don complicated things, as long price didnt break the higher low, bullish still in the move.

OCNCASH - what STOCH is telling us?MYX:OCNCASH is a supplier of non-woven fabric, material needed in face mask production. Read here .
Few days ago, US Fed declare second wave infection in the country.
19 June, WHO alert on the acceleration of Covid19 cases. Read here .
Will people go out without face mask in this time? I will not do that.
So what STOCH indicator is showing on OCNCASH daily chart?
6/12/2019, when slow stock cross up the fast, it end up gain 75% about 1 month later.
19/2/2020, after cross up, it end up gain 26% about 3 weeks later.
20/3/2020, cross up happened again few days after Malaysia lockdown, end up gain 193% 3 months later.
19/6/2020, slow STOCH cross up again, where will it heading to? With the news of second wave Covid19 and the opening of more face masks factories, surely there is something good with MYX:OCNCASH this time. I agree that STOCH oversold state can last for few days or weeks, but this might be the beginning of a major trend reversal.


Continue to Swing until the end of PandemicStarted new trade at average EP of RM0.75.
Prices should peak between RM1 to RM1.15 within 2 weeks before retracing.


Still keeping faith after a past trade mistakePlanning a swing trade based on current trend after a past mistake.
To buy in more stocks if it is confirmed to be uptrend tomorrow.

Riding the Pandemic Wave with an Undervalued StockWhen I first started in the stock market, OCNCASH (face masks), AWC (building disinfection or sanitizing) and CCK (fishballs) were on my list for consideration.
Out of the three I only managed to get into AWC in April 2020.
After I disposed off some long term stagnant counters, with some capital freed up I could choose between OCNCASH and AWC. I left CCK out as I believe that the demand for fishballs whether with or without the pandemic would remain constant.
Between OCNCASH and AWC based on the respective share prices in mid of May 2020, OCNCASH seems to be undervalued whereas AWC has hit its fair value. Therefore I have entered OCNCASH this time around, targeting to release as the share price reaches its fair value.

OCNCASH to complete V-Shape like its peers i.e CAREPLS, ADVENTA?OCNCASH closed Green last Friday with price managed to break Span B of Ichimoku Cloud's lines, which is a strong resistance indeed. Current Support Level is seen at 55.5c then 50c as per Fibonacci Retracement levels and Ichimoku Cloud's lines. Next soft resistance is seen at 62c before potentially testing 67c and 70.5c as per Ichimoku Cloud's lines, Fibonacci Retracement levels and past candlesticks pattern. If it were to complete the V-Shape like what had happened to CAREPLS and ADVENTA after breaking the Span B line, potentially testing 82c. Ichimoku Cloud indicates uptrend for OCNCASH after Span A has crossed Span B for forward looking trend. MACD and Stochastic has yet to show Sell signal. My 2 Cents. TAYOR :)


EASY123 Prediction @MYX OCNCASHLife is simple...Trade with Simplicity!
BUY Signal = (BT-Yellow-Diamond), (White-Candle), (Green-Upward-Triangle), (White-Star)
SELL Signal = (Red-Dot), Red-Downward-Triangle)
*The trend direction: Uptrend (Green background Uptrend signal observed) *Must not break below S2 to keep as Uptrend.
*Price tested the lifeline (Redline) & close above it on 04-Mar.
*The White-candle cum BT signal on 25-Feb, an indication of Bottom.
Prediction: The current price pullback/correction and supported above the lifeline (S1 to lifeline region)
Preference Strategy: Swing trading (Follow the BUY/SELL Signal respectively.)
Target Price: RM0.58-63 & RM0.77-0.80
Cut Loss: If broke below S1 RM0.48 or S2 RM0.41
*Reminder TP & CL is an individual preference & decision. No fix rule or guideline for it...Trade at your own risk.
