PAAlgo TradingSystem by Remisier CheDin
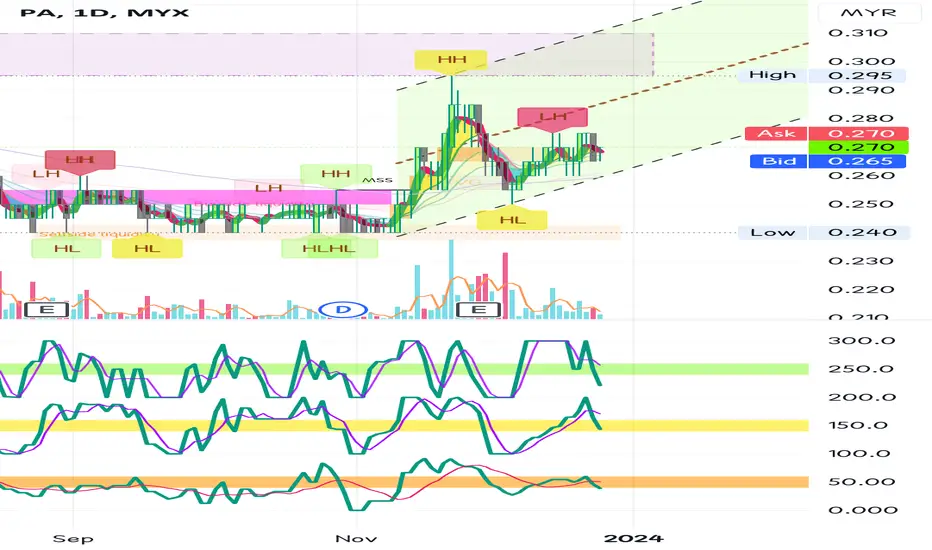
The current market conditions, as identified by my algorithmic system, indicate potential upward signals. These signals include increased trading volume, an upward trend with prices above the EMA20 and EMA50. Consequently, the present conditions suggest a possible upward trend.
It's crucial to remember that trading strategies account for only 10-20% of your overall trading success. The majority of your success depends on effective risk management. This involves having a well-defined trading plan and appropriate position sizing, which are essential for maintaining the right trading psychology. Master your risk management and trade according to your plan.
PA trade ideas

MY: PA Resources Analysis 17.5.24Has break Resistance. Fibo TP at 0.48.
Manage to entry at 0.39. Personally, Will have short TP at 0.43.

PA, AlgoSignal reveals potential uptrendSeveral indicators within my algorithmic system are signaling a potential uptrend. These include:
- Increased volume: Activity is picking up, suggesting growing interest and potential momentum.
- Mid- to long-term uptrend: Both the 50-day and 150-day exponential moving averages are pointing upward, indicating a sustained positive trajectory.
These factors collectively point towards the possibility of an upward movement in the near future.

PA was triggered based on the MRV1 on 20 Dec 2023The PA buy signal was triggered based on the MRV1 setup at RM0.275. The target is a 20% increase to RM0.330, with a stop loss of RM0.245. This is expected to take 2–3 months due to the signal being based on the daily timeframe.
Not muuch can be said on its movement but I like how it presents itself. Coming off a downtrend from the start of the year, stopped falling and go flat. Making new higher low and higher high. A price spike to visit its near resistances of RM0.280 and RM0.320 is likely in near term. Support is seen in the RM0.240.
**This is for discussion purposes only and is not a buy/sell call**

PA Resources, how it would be?22/11 touch FVG area and pullback.
Currently price at lower part of Parallel Channel, need to be careful as it may breakdown.
>> Price below Hull MA, personally will avoid ATM.
>> DC for Stochastics and RSI... Buy dip? Think twice though.
>> Possible to up? Maybe.. but might slow. I prefer fast moving things. Skip PA ATM.
"chart reading can go wrong or inaccurate". Always do own due diligence.
Disclaimer: Mentioned stocks are solely based on own opinions for education and/or discussion purpose only. There's no buy and/or sell recommendation. Trading involve financial risk on your own. The author shall not be responsible for any losses or lost profits resulting from investment decisions based on the use of the information contained herein.
BREAK UPPER TRENDLINE PAFundamental,lost on last QOQ,but improve on YOY.Price has been broke the upper trendline.However need to past a latest horizontal line before it can fly
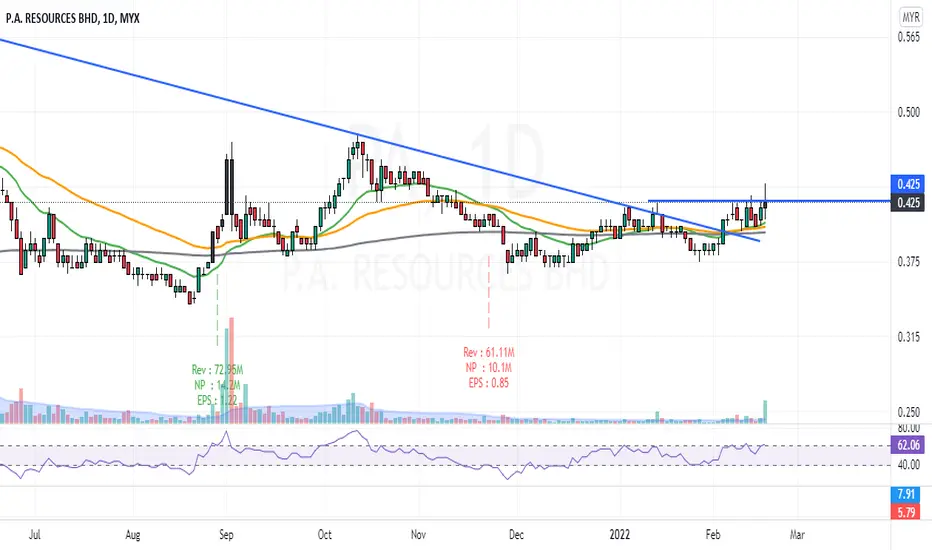
BREAK UPPER TRENDLINE PAQuite a stable company.Institutional favourite also.Price has break the uppertrendline,but not with significant amount yet.

P.A. Resources BhdGOODLUCK TRADERS
TRADE AT YOUR OWN RISK
buy at the support,sell at the resistance will be recommended!!!
“Compound interest is the eighth wonder of the world. He who understands it, earns it. He who doesn’t, pays it.” — Albert Einstein
JUST MY OPINION!
NOT A FINANCIAL ADVISE!!

PAFrom my view PA has not yet given any reversal pattern.
For comfirmation price must BO from the channel line and closed above 0.415.
#TAYOR MYX:PA

PA - True tester Down Trendline?Trendband cycle build up but no breakout candle for today. Now pullback to test Down Trendline. See how next candle react. EP above 0.475 would be good but look at pullback for EP also a smart move. Look for reversal candlestick at pullback area/Support area.

P.A (Aluminium).Maybe expanding flat .ABC (red circled) 6/9/21P.A one of aluminium related theme stocks.. Possible forming an expanding flat pattern ABC ( Red Circled). where price could reach at around RM1.00 which is the next major supply zone

PA has overcome its selling pressure over the past monthSuccessive higher lows and higher highs. A fresh MACD GC just occured and RSI is increasing indicating growing strength in bullish momentum. This is looking to retest ATH at 0.570 and the creation of a NEW All time high.

PA's weekly bullish breakout. Post #3On the weekly timeframe, PA is breaking out of its 52week high. and its MACD has formed a GC above 0. Its volume is increasing week on week and depicts strong buyers are in control of the stock price. My TA indicators are all pointing towards the continuation of the uptrend for PA for weeks to come ceteris paribus.
Key levels to watch out for:
R1 = 0.60
S1 = 0.52
The final decision to buy/sell is yours.
-FairTrades


PA : Too late to the party (Medium term - Wave analysis)It appears that our previous wave count earlier in May (posted on 5/5/21) was void after PA failed to break into new high and instead move down lower. Our new wave analysis reveals that the 5th wave was truncated in a form of an ending diagonal. The selloff that follows was a corrective wave A of a zig zag followed by a bounce to form wave B. We believe the correction has not ended and wave B might terminate at 78.6% fib retracement level of wave A before heading down lower. Nearest potential support for wave C termination seen at RM0.390 which is at 38.2% level followed by RM0.330 at 50% level. The medium term outlook on PA appears bearish at the moment and we will continue to monitor the stock for signs of bottoming before taking any long position.

PA Going DownBased on Weekly and Daily timeframe,
The long trend would see that PA will go bearish heading to 0.360
Let's see how it will play out.

PA : Nobody gets left behind (Medium term - Wave analysis)Amidst the recent broad bullish sentiment in steel stocks, we believe PA resources one of the few laggards in the group might soon join the bull party. Based on our wave counting, the recent moves in PA appears to be the start of wave (v). Earlier in April, it completed a double three corrective pattern of wave (iv) and slowly climbing its way up approaching its previous 52 weeks high at RM0.595. A breakout above this level could send the stock soaring towards RM0.97 which is in our opinion the most conservative target since we are using the 0.618 ratio from wave (i). 5th waves are however tend to be in equality to 1st waves when 3rd waves are extended. If the latter does happen, a more optimistic target of RM1.25 area might be possible.

PA: Buy on BreakoutPA almost broke out its resistance on 3rd May, at 0.55.
EP: 0.55
SL: 0.50
TP: 0.62


Another breakout happening soon?BUY
- Buy around 550 within the area between 550 and 575
- If it can’t break 590, it might go back to the range of 550 – 575 in hope to forming a lower level of volatility of less then 7% - shake out the previous hands in Jan & Feb (+90%)
SELL
- SL is around 515 with a -7%
- Observe accordingly since there are multiple resistances from years back
RATIONALE
- Reduced volatility towards the right of the chart
- Another smaller cup might be formed within the cheat area if it can’t break the previous high
**the analysis is solely for my own references and learning

<TradeVSA> PA forming VCP. Ready for Breakout?Sign of Strength in the chart:
1. VCP in re-accumulation
2. Double NS at support
3. High volume at resistance
4. Green Pentagon above 20/40ma
Disclaimer
This information only serves as reference information and does not constitute a buy or sell call. Conduct your own research and assessment before deciding to buy or sell any stock

