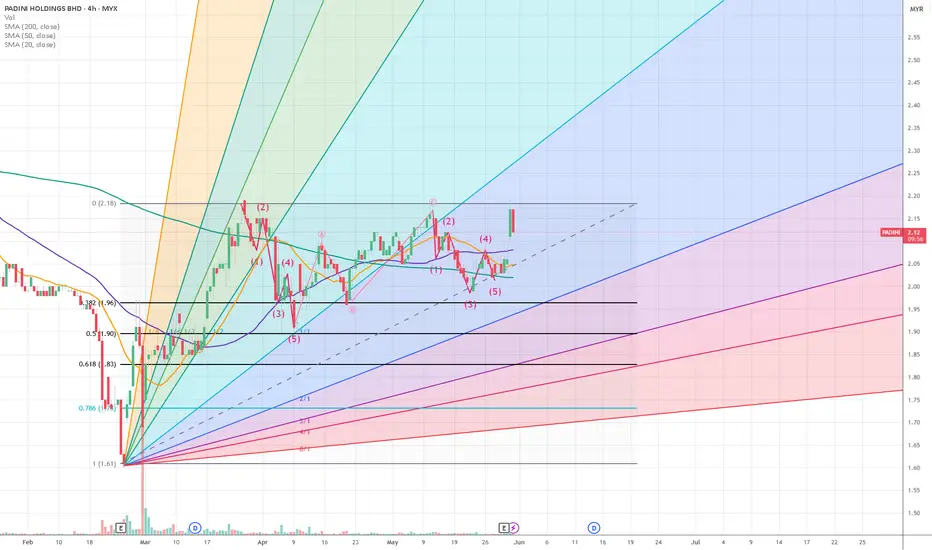
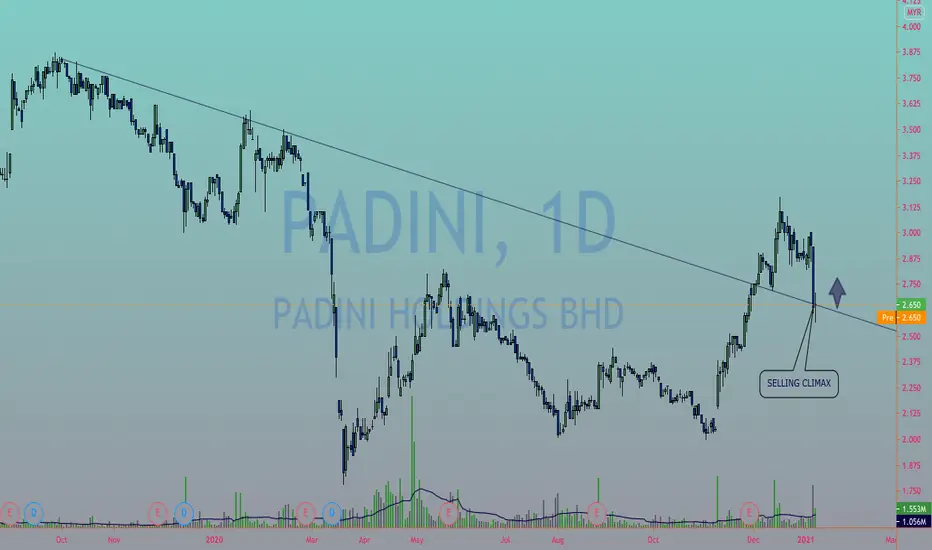
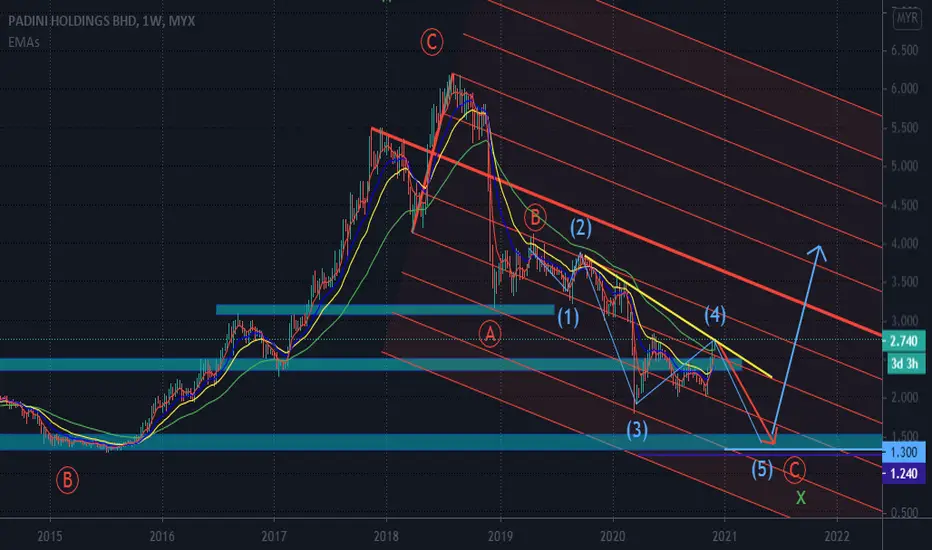
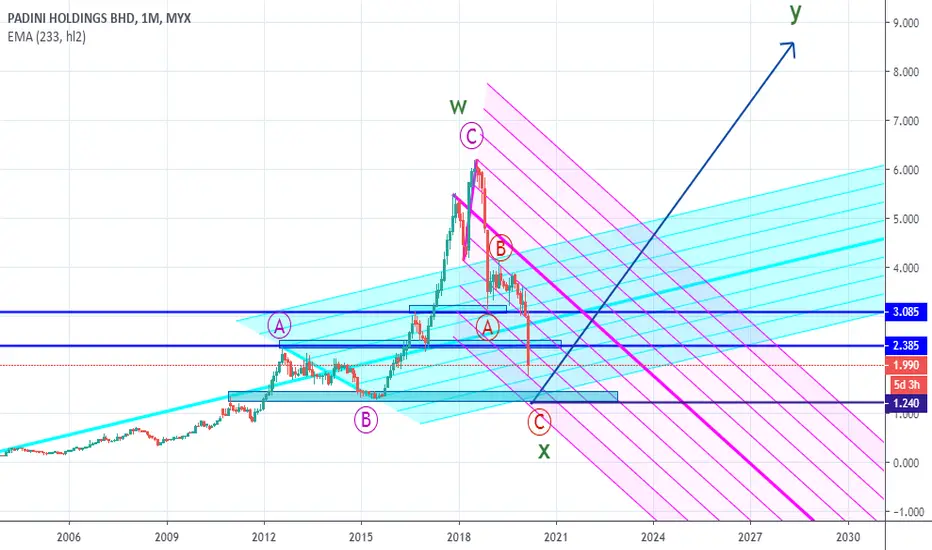
PADINI is moving to 3rd wavealready retraced to 0.5 level during retracement of 2nd wave
tried to calculate the wave ... seems like ABC correction of 5-3-5 already finished
will give dividen albeit a bit lower than previous
but still a good fundamental company
PADINI trade ideas
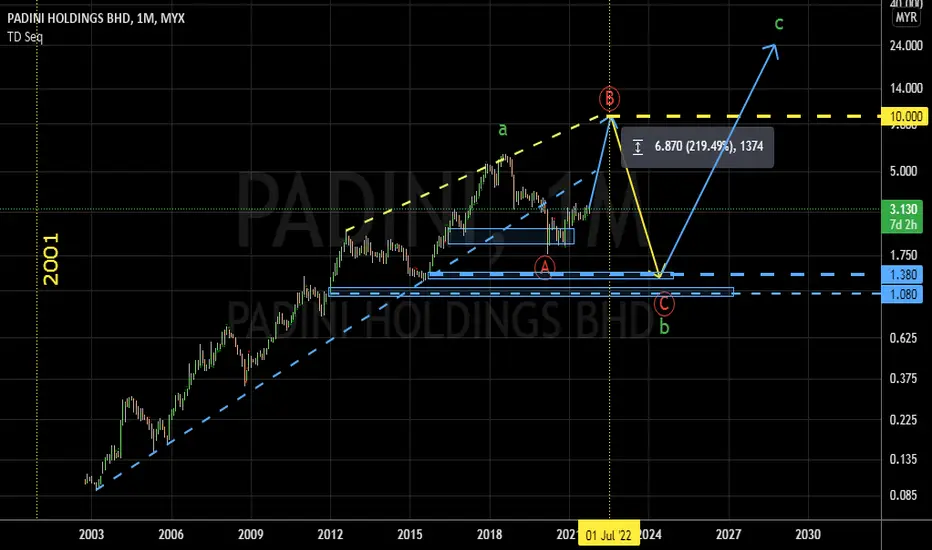
PADINI potential >200% to reach around RM10.. 22/Oct/21PADINI stock price may reach at around RM10 at the upper line of ascending broadening wedge pattern.. Before a big "crash" .. for expanding flat pattern..
LOW CHEAT SETUP PADINIIf parkson can,y dont me?Improving YOY sales and profit.Forming low cheat setup.Need to break above the box with high volume to confirm setup
PADINIEntry Point resistance 3.17
Profit Target min 3.57
Stop Loss 2.99
#JerungDetector #DeepagiScreener

PADINI predictionPADINI is going up quite nicely with the trend line doesnt seem it will drop now but soon be caution of new high

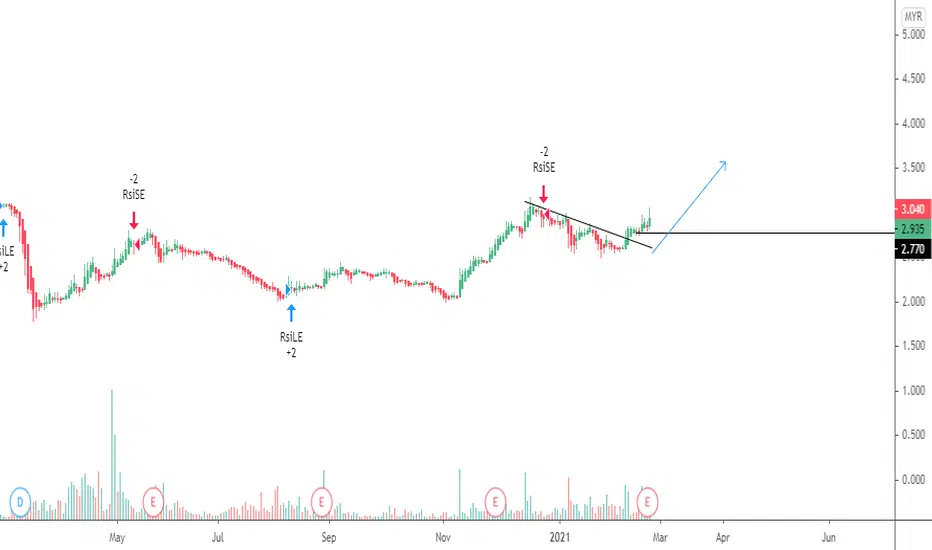
PADINI 7052 MYX 18/3/21Study...based upon Volume Price Spread Analysis and Momentum
Padini has shown both Breakout and Momentum.
Close: 3.14
EP: 3.07 - 3.20
SL: 2.76
TP: 3.38 / 3.69/3.89
Disclaimer: This study does not constitutes Buy/Sell per say. Please consult your financial advisor before making any trading/investing decision

Padini - Bought 17/3/21Padini - Bought 17/3/21
Why?
- Breakout 52 weeks high with high volumes
- Recovery play
- Good luck cha


PADINI for long termthis is Malaysia stocks
both 1hr and monthly timeframe indicates golden cross
1hr break cup & handle pattern which indicates to go uptrend..


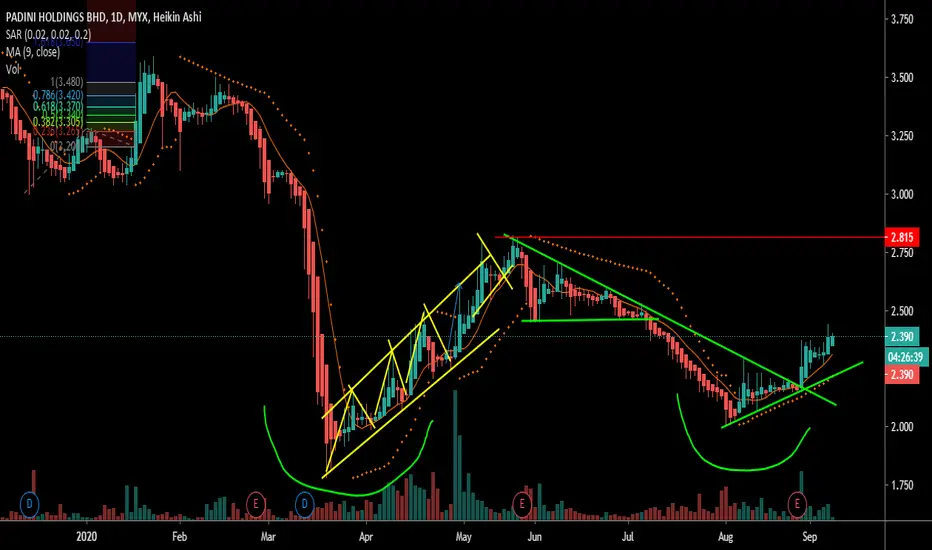
'Window' ShopPADINI has recently made significant bullish movement this month, breaking a valid downtrend line and price has recently close above 50-period MA in weekly timeframe. Our short term target is at 3.1. Exit below 2.0
Disclaimer: The content on this analysis is subject to change at any time without notice, and is provided for the sole purpose of assisting traders to make independent investment decisions.

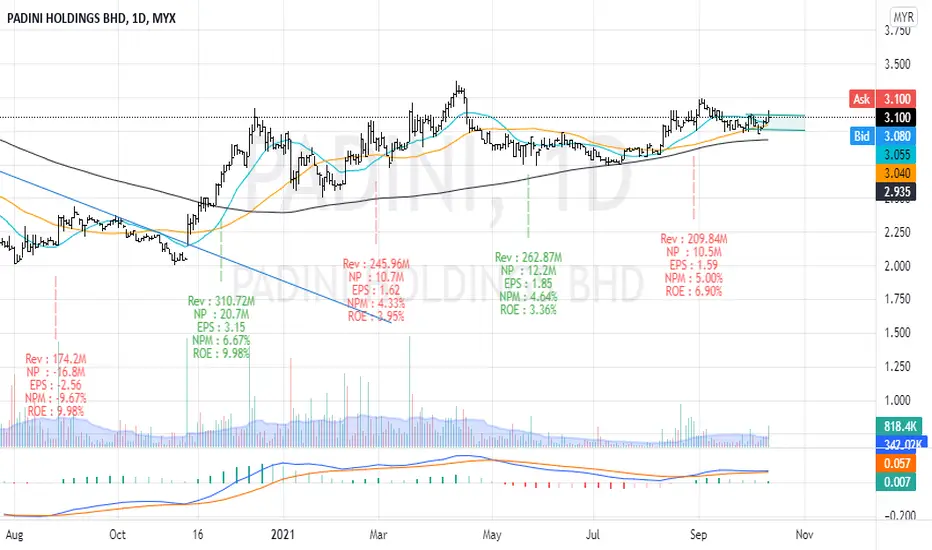
Padini - Net Cash + 3Q Rpt up 5.7%Padini share price just cross up Moving average 200 days and 3rd quarter report earning up 5.7%.
Also is sign of earning recovery.
(Disclaimer: for demonstrate own planned trade records study only and education purpose, not for recommend to buy or sell. Trade at your own risk)

PADINI -- BULLISHU GUYS SHOULD SERIOUSLY CONSIDER THIS BEAST.. DOUBLE BOTTOM FORMED. HEIKIN ASHI BULLISH, PSAR BULLISH. MAY U GUYS HAVE A HAPPY RIDE AHEAD
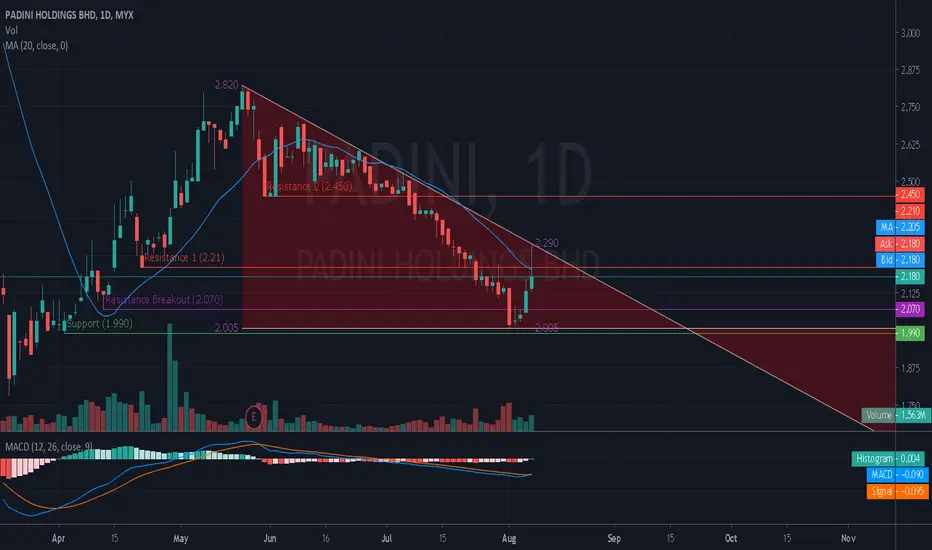
Below 20MA , Descending TriangleTechnically, it is not looking good for PADINI as its 20-Day Moving Average is sloping downward and its price action is below the Moving Average line.
Furthermore the support level is still quite far at 2.01.
Descending Triangle identified at 3 Aug 20.
This pattern is still in the process of forming.
Possible bearish price movement towards the support within next 49 days (ETA 21 Sep 20)
Resistance 1 : 2.45
Resistance 2 : 2.21
Support : 1.990
Resistance Breakout : 2.070 (13 Apr 2020)
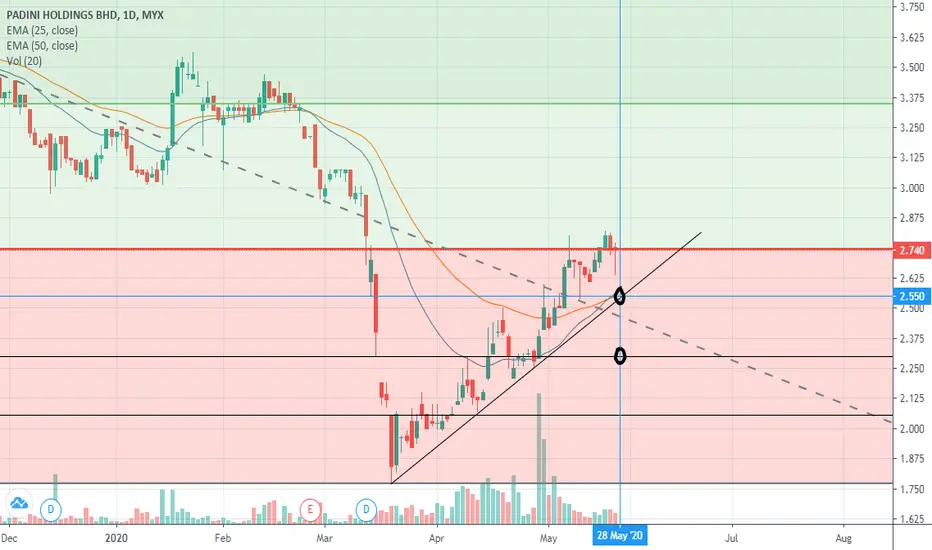
Padini, how low you can dip?Can the chart measure how deep is the water?
Let's see. First support rm2.55. Second support rm2.30. 3rd support 2.100.
Last support 1.78.


PADINI Fashion.When was your last purchase? Good Dividend StockPossible RM2.38 is a good buy.. For Education ONLY
