PAOS buy signal based on MRV2 setup on 4 Jan 24 at RM0.390
Buy signal for PAOS observed on 4 Jan '24 at RM0.390 based on the MRV2 setup, a higher risk version of the original MRV1.
MRV1 triggered on 19 Dec 2023 at the closing price of RM0.405.
The support area could be established at the equilibrium support area of RM0.380. The suggested stop loss is se
−0.020 MYR
−3.43 M MYR
614.15 M MYR
About PAOS HOLDINGS BHD
Sector
Industry
Website
Headquarters
Shah Alam
Founded
1997
ISIN
MYL5022OO008
FIGI
BBG000BZKZ72
Paos Holdings Bhd. is an investment holding company. It operates through the following segments: Manufacturing, Trading, and Integrated Hotel Operations and Property Investment. The Manufacturing segment is involved in contract manufacturing, dealing of soap and its related products, products from palm oil, and specialty fats. The Trading segment refers to the business of specialty fats from palm oil, soap, and marine gas oil. The Integrated Hotel Operations and Property Investment segment includes the management of hotels, restaurants, and investment property holding. The company was founded on November 11, 1997 and is headquartered in Shah Alam, Malaysia.
Related stocks

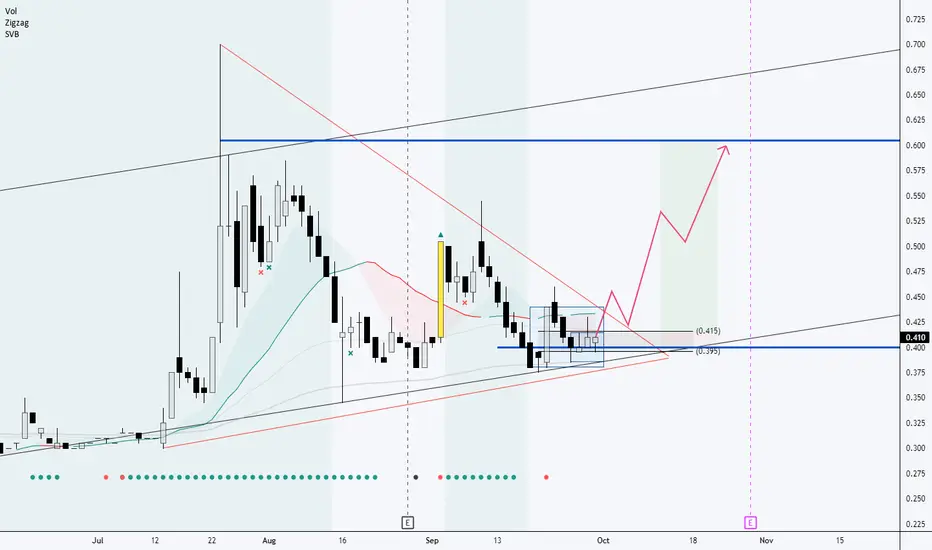
PAOS - Testing Down Trendline?Nice Trendband cycle build up. Now pullback to test Down Trendline. See how next candle react. Maybe looking for new Higher Low? EP at pullback as trading plan (right-top)

VCP 2 formingWAIT for the yellow candle for entry confirmation, with volume flow analysis, stop loss below weekly support (accumulation area spotted )
PAOS (10/09/2021)*Study Counter*
CI - Market is trending for possible spike
WM - Whale in high volume, but looks like starting to look down
MM - Peak and heading to oversold
Pattern - complete Falling wedge,
complete head and shoulder and
complete Bearish Gartley Pattern, already past 1st target,
possible t

A Reversal Signal!The price closed above MA20 hence high probability of a reversal signal. MACD and OBV charts do not yet show divergence signals. When MACD and OBV charts show divergence signals then it will be a long position trade. Put this in your WL and watch out for divergence signals.
R 0.545
S 0.345

PAOS Bullish Butterfly PatternMy Expectation using Butterfly pattern in Hourly TF for price can drop to 0.25 (1.27%) and rebound back to 0.38.
#TAYOR MYX:PAOS

See all ideas
Summarizing what the indicators are suggesting.
Oscillators
Neutral
SellBuy
Strong sellStrong buy
Strong sellSellNeutralBuyStrong buy
Oscillators
Neutral
SellBuy
Strong sellStrong buy
Strong sellSellNeutralBuyStrong buy
Summary
Neutral
SellBuy
Strong sellStrong buy
Strong sellSellNeutralBuyStrong buy
Summary
Neutral
SellBuy
Strong sellStrong buy
Strong sellSellNeutralBuyStrong buy
Summary
Neutral
SellBuy
Strong sellStrong buy
Strong sellSellNeutralBuyStrong buy
Moving Averages
Neutral
SellBuy
Strong sellStrong buy
Strong sellSellNeutralBuyStrong buy
Moving Averages
Neutral
SellBuy
Strong sellStrong buy
Strong sellSellNeutralBuyStrong buy
Displays a symbol's price movements over previous years to identify recurring trends.
Frequently Asked Questions
The current price of PAOS is 0.340 MYR — it hasn't changed in the past 24 hours. Watch PAOS HOLDINGS BHD stock price performance more closely on the chart.
Depending on the exchange, the stock ticker may vary. For instance, on MYX exchange PAOS HOLDINGS BHD stocks are traded under the ticker PAOS.
PAOS stock hasn't changed in a week, the month change is a 28.30% rise, over the last year PAOS HOLDINGS BHD has showed a −5.56% decrease.
PAOS reached its all-time high on Oct 24, 2016 with the price of 0.915 MYR, and its all-time low was 0.200 MYR and was reached on Jul 1, 2020. View more price dynamics on PAOS chart.
See other stocks reaching their highest and lowest prices.
See other stocks reaching their highest and lowest prices.
PAOS stock is 0.00% volatile and has beta coefficient of 1.13. Track PAOS HOLDINGS BHD stock price on the chart and check out the list of the most volatile stocks — is PAOS HOLDINGS BHD there?
Today PAOS HOLDINGS BHD has the market capitalization of 61.60 M, it has decreased by −2.86% over the last week.
Yes, you can track PAOS HOLDINGS BHD financials in yearly and quarterly reports right on TradingView.
PAOS net income for the last quarter is 353.00 K MYR, while the quarter before that showed −1.64 M MYR of net income which accounts for 121.56% change. Track more PAOS HOLDINGS BHD financial stats to get the full picture.
EBITDA measures a company's operating performance, its growth signifies an improvement in the efficiency of a company. PAOS HOLDINGS BHD EBITDA is −1.04 M MYR, and current EBITDA margin is −0.17%. See more stats in PAOS HOLDINGS BHD financial statements.
Like other stocks, PAOS shares are traded on stock exchanges, e.g. Nasdaq, Nyse, Euronext, and the easiest way to buy them is through an online stock broker. To do this, you need to open an account and follow a broker's procedures, then start trading. You can trade PAOS HOLDINGS BHD stock right from TradingView charts — choose your broker and connect to your account.
Investing in stocks requires a comprehensive research: you should carefully study all the available data, e.g. company's financials, related news, and its technical analysis. So PAOS HOLDINGS BHD technincal analysis shows the buy rating today, and its 1 week rating is buy. Since market conditions are prone to changes, it's worth looking a bit further into the future — according to the 1 month rating PAOS HOLDINGS BHD stock shows the buy signal. See more of PAOS HOLDINGS BHD technicals for a more comprehensive analysis.
If you're still not sure, try looking for inspiration in our curated watchlists.
If you're still not sure, try looking for inspiration in our curated watchlists.