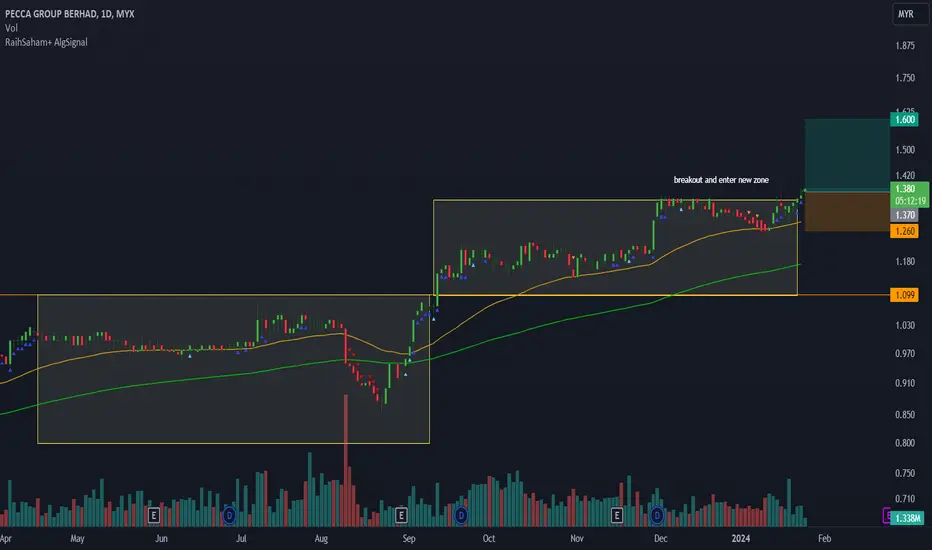
PECCA MARKING UPPecca, an Atypical Type of Schematic #2 Wyckoff Re-Accmulation
Why Pecca?
technically =
1. Feather's Weight (red crescent)
2. Absoprtion (Red arrow)
3. fulfilling Wyckoff 9 Buying point
TriggerBar today, as a test, for a follow through in the upcoming days.
Position initiated as attached
PureWyckoff
PECCA trade ideas


PECCA will create 5th WAVE The current price is 1.43 with a gain of 0.04 (+2.88%). The stock is currently trading at 1.43, up from an earlier value of 1.42.
Key technical indicators visible include:
Volume (Vol 20): 4.94M shares with 2.89M average
Multiple moving averages: SMA 50 (1.44), SMA 20 (1.45), SMA 10 (1.42), and SMA 200 (1.34)
Supertrend indicators with values 1.92 and 1.39
The chart shows several buy and sell signals marked throughout the price history, with the most recent being a "Sell" signal near the current price level. There's a notable pattern of price movement between support and resistance levels, with diagonal trendlines drawn on the chart.
The lower panels display volume data, cash flow metrics, and net income figures with specific Malaysian Ringgit (MYR) values noted at different time periods (Sep '23, Dec '23, Mar '24, Jun '24, Sep '24).
The price appears to have recently declined from a peak around 1.55, but remains above the longer-term SMA 200 support level of 1.34.

Pecca, able to breakout ?Is it possible for PECCA to make a healthy pullback and retest its resistance levels?
In the world of technical analysis, such a scenario often depends on market conditions and the stock's current momentum. A healthy pullback typically occurs when a stock temporarily retraces some of its gains after a strong upward movement, allowing it to consolidate and gather strength for another potential move higher.
If PECCA maintains its underlying bullish trend, a pullback to key support levels could provide a base for the stock to rebound and make another attempt at breaking or retesting resistance. Factors such as trading volume, overall market sentiment, and fundamental developments will also play a critical role in shaping this potential move.
Investors should closely monitor these levels and assess the broader market context to gauge the likelihood of a successful retest.
Disclaimer: Please be informed that all stock picks are solely for educational and discussion purposes; they are neither trading advice nor an invitation to trade. For trading advice, please consult your remisier or dealer representative.

Pecca, coming soon?There's something interesting happening with Pecca that might not have caught everyone's attention. While it's uncertain if things will go according to plan, the pattern observed around the last three ex-dividend dates shows a noticeable price pump.
Currently, the stock price is below most of the EMA lines, yet it sits at a potential rebound area. The RSI indicates that the stock is oversold, hinting at a possible rebound. Additionally, the MACD on shorter timeframes shows some movement, offering a subtle indication of an upward trend.
However, if the stock fails to stay above the Hull MA, it could face significant downside risk.
With about three weeks remaining until July 15th, it will be interesting to see how things unfold.
Disclaimer: The mentioned stocks are based solely on personal opinions for educational and discussion purposes only. There are no buy or sell recommendations. Trading involves financial risk, and you are responsible for your own decisions. The author shall not be responsible for any losses or lost profits resulting from investment decisions based on the information contained herein.

PECCA: AlgoSignal reveals potential uptrend.Several indicators within my algorithmic system are signaling a potential uptrend. These include:
- Increased volume: Activity is picking up, suggesting growing interest and potential momentum.
- Mid- to long-term uptrend: Both the 50-day and 150-day exponential moving averages are pointing upward, indicating a sustained positive trajectory.
These factors collectively point towards the possibility of an upward movement in the near future.

IS PECCA GOING UPWARDToo many stepping stone
Yellow box indicate of what David Weiss termed as 'Battering ram of castle door' --- The line of Least Resistance
A classic sign of absorption
with the assumption of Re-Accmulation (Shcematic #2) is on going,
position initiated as attached
Pure wyckoff

HARBOUR, Uptrend based on AlgoSignal StrategyThe current point exhibits promising upward signals according to my algorithmic system, meeting various criteria. These include rising trading volume, an upward trend indicated by prices above EMA20 and EMA50, and the closing price surpassing VWAP. As a result, the present conditions suggest a potential upward trend.
Pecca's Potential Resistance Breakout ?Waiting for a clear price breakout before initiating a buy strategy. Closely monitoring the price movements, to capitalize on the momentum generated by the breakout.

PECCA - TA1. Price candle break out MA 200 on 24 Aug '23 give strong signal the price movement may change direction to bullish soon.
2. Price candle testing MA 200 on 14 Aug '23 to 23 Aug '23 to shake out weak retailers. Next price candles break out MA 200 on 24 Aug '23.
3. GC (Golden Cross) MA 50 & MA 20 not yet happen, once happen this will give another strong signal the price is build up the uptrend momentum and ready for bullish.
4. Price candle and MA 200+MA 50+MA 20 not yet aligned altogether, once happen this will give sign the price is ready for bullish.
5. Price candle currently try to BO strong resistance (1.07-1.10) on 5 Sept 2023 to 7 Sept 2023. PB may take place to setup a support area at 1.03 - 1.01. At this area GC may happen, once happen this the 1st EP.
6. EW analysis includes in this TA together with sub wave & main wave count. Based on EW analysis, price movement for this counter going to complete Sub wave V - Main wave 5 with target price 1.32- 2.14. This is the last wave before major correction happen.

PECCA - should BOD (buy on dip)?Some question that traders or investor may think of, "should they BOD?"🤔
Think to consider before next step:
>> broken the uptrend pararrel channel.
>> price dropped more than -10% in a week.
>> price below Hull MA / red blue sea.
>> yet has any recovery signal, but when the signal come? Don't know. Maybe next trading days, next week? We cannot decide it, and it very depend on market player to make the decision.
Maybe the old me, I may simply collect some from here and there. And pray to Stock God for the price to up and let me earn some in that particular counter.
Learn from mistake, we cannot against the trend/ the operator. Except we have huge cash of billions to pump it. Or else, just follow operators.
Disclaimer: Mentioned stocks are solely based on own opinions for education and/or discussion purpose only. There's no buy and/or sell recommendation. Trading involve financial risk on your own. The author shall not be responsible for any losses or lost profits resulting from investment decisions based on the use of the information contained herein.

PECCA Weekly Chart VCPWilliam O'Neil got a lot of weekly chart example in his book: How to Make Money in Stocks.
PECCA chart is hidden in daily chart. Amazing setup seen in weekly chart. The base of the chart used 770 days to form with below contraction:
C1: -43%
C2: -15%
C3: -6%
C4: -5%
Attempt breakout last week and pull back this week (natural reaction), forming a pivot and this is consider a low risk entry point (<5%)
Let's monitor.
Disclaimer: Information presented here is not intended to be used as the sole basis of any investment decisions nor should it be construed as advice designed to meet the investment need of any investor. Trade at your own risk.

PECCA HUGE BASE VCP SETUPPECCA appear in the screener and look at this huge base >600 days VCP setup.
C1: -44%
C2: -16%
C3: -3%
QR yet to released, based on the early volume and price movement, expected good QR that will be released on 27th or 28th. Let's see if pull back after QR for better entry point or not.
Anyone spotted this stock too?
Disclaimer:
Information presented here is not intended to be used as the sole basis of any investment decisions nor should it be construed as advice designed to meet the investment need of any investor. Trade at your own risk.

Will PECCA continue uptrend?Inverted head and shoulder in the chart.
Focus on the nearest resistance.
Set up your trading plan properly.


PECCA Double Bottom + Higher LowPECCA weekly chart got below setup:
Left side: Double bottom
Right side: Higher low, entering stage 2
This counter entering stage 2 since end July. Currently setting up a higher low. Not yet a solid entry point but is good to start monitoring the movement. I will update again later in below when the time come. Stay tune.
This is our routine as a Trader! Previously spotted HEXIND, HEXTAR, PTRANS etc. (see previous link below)
Disclaimer:
Information presented here is not intended to be used as the sole basis of any investment decisions nor should it be construed as advice designed to meet the investment need of any investor. Trade at your own risk.

PECCAEP 0.825
TP 0.845
SL 0.8
Backtest result from 2022-08-05 11:30:00
42 trades
71% win rate
p.s: not a financial advice
#deepagiscreener #TAYOR #bursa


Risk and Reward Risk and Reward is not accepted as the breakeven areas is huge.
Can study as case reference

Pecca starting an uptrendPecca, an automotive upholstory company turned to ppe making company. Automotive product is already a strandard , with the epidemic has succeeded in creating a new income stream. After a lacklustre finish to previous quarter a selling climax is seen with another composite operator taking over as price became attractive. A reaccumulation ensues and later a reversal to an uprtrend follows. Both price objective through pnf and ew target are shown

Rebounce from bottomFrom the Fibonacci chart, PECCA already rebounce hence showing an uptrend pattern. Where the price movement in the overall direction is upward. If the price hit above MA20 then it will be in a long trade position.
R 3.315
S 2.810

Learning : Pecca, a potential technical rebound.Disclaimer : This is for learning purpose, no recommendation of buy/sell
Pecca completed the uptrend and is now on the downtrend.
Stocks price crossunder moving average 20 (MA20) and has dropped more than 15%.
During the drop, there was potential chip accumlation as indicated in Chips Masters.
The candles are now at the vicinity of -15% of MA20.
There were stop dropping doji , followed by a rebound bullish engulfing , and now with candle above MA5 .
Based on Granville Rules, this is a potential technical rebound of point number 4 as depicted in diagram on the right.

