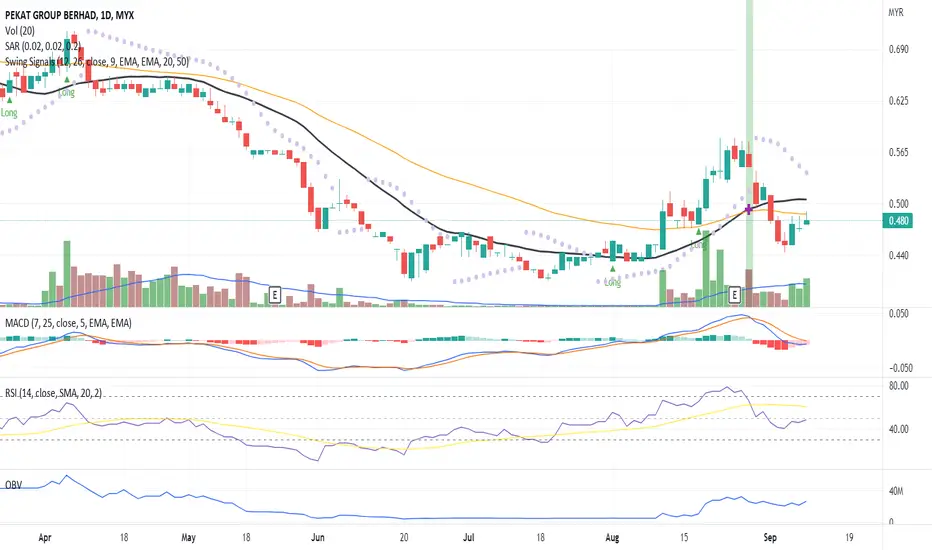
PEKAT CONT MARKING UPThis is a continuation of my prev thesis for Pekat
**Refer prev post
Since my previous position, Pekat has been always under my radar.
(This is a Stepping Stone Zone, Continuation from previous Mark Up Phase)
what caught my attention, the formation of BUEC consistenly unfolding in the backgro
Next report date
—
Report period
—
EPS estimate
—
Revenue estimate
—
0.05 MYR
22.00 M MYR
286.98 M MYR
240.57 M
About PEKAT GROUP BERHAD
Sector
Industry
CEO
Yee Chee Tai
Website
Headquarters
Petaling Jaya
Founded
1999
ISIN
MYQ0233OO005
FIGI
BBG01192SJC7
Pekat Group Bhd. designs, supplies and installs solar PV power plants. It operates through the following segments: Segment I, Segment II, and Segment III, and Segment IV. The Segment I focuses on the design, supply, and installation of on-grid and off-grid solar photovoltaic systems and power plants which also includes the entire scope of work up to delivering of system or plant to customers and operations and maintenance of the systems or plants. The Segment II includes supply and installation of earthing and lightning protection systems for buildings, facilities and structures to protect people, property and equipment from unintended electric current as well as providing specialist subcontractors for earthing and lightning protection systems to main contractors or mechanical and electrical contractors. The Segment III involves the distribution of electrical products and accessories which includes sales and marketing of Pekat own brand and other third-party brands electrical products and accessories. The Segment IV involves in the manufacturing, engineering and project activities, providing a wide range of products and services to the generation, transmission and distribution sectors of the electrical power industry. The company was founded on August 5, 1999 and is headquartered in Petaling Jaya, Malaysia.
Related stocks

PEKAT MARKING UPA Type #2 of Re-Accumulation Schematic
previous entry as attached (not too much profit secured)
Past few days noticed the BUEC (phase D)
With that in mind, possiblity starting of the campaign for phase E, which is price to mark up outside the Trading Range (BOX)
With A Trigger Bar t

PEKAT STOCK ROAR 2025?DEMAND WILL PLAY AROUND BOX RANGE 855-935
SUPPORT can wait 920
and will close monitor when break 1.06
it should be clearly make it higher high
and stage 2 will confirm with high volume.

PEKAT GROUP BERHAD
The price action is moving towards the upper band, which could signify the start of a short-term bullish movement if the price breaks out above the upper band.
Price Action: After a significant rally in May, the stock retraced and found support near MYR0.85. This was followed by a period of sidew

PEKAT June 2024 - Update 2 : Friday Rule
Friday Rule Applies.
Last Friday , breakout new 52-WH
( but closed weak , as general market breaks below 1600 level )
continues to break new 52-WH today.

PEKAT : High tight flag , volume profile & 10WEMA , Friday Rule
prior run up >70%
breakout 10 weeks EMA
pullback to EMA10
support at VP POC and EMA10
break out new 52 weeks high today (Friday )
potential Friday Rule Candidate
also showing relative strength ( breaking out while the Market is in a correction )

PEKAT May 2024 : trading range using Fixed Volume Profile
Volume Profile showing P-Profile Characteristics
in the current consolidation zone , in the upper node of P-Profile:
- price hovers around VP POC - area of highest acceptance & trading activity
- price rejects Value Area High ( VAH ) and Value Area Low ( VAL ) - acts as support & resistance

Emerged of Buying Interest!The RSI indicates a positive outlook due to the emergence of buying interest from the previous trade. Hence pushed the price into a significant price movement backed by high volumes.
The MA13 crosses up the MA50 indicating a strong uptrend toward the next price resistance backed by the MACD indicat

A Reversal Trend!The candlestick indicates a trend change in the price of the stock due to buying interest backed by significant volume compared with the previous trading.
The 0.475 is the price Point of Control with fresh buying interest that has emerged and is set to lift the stock higher.
MACD and OBV also indi
Emerged of Buying Interest!A significant price movement on 10 Aug'22 due to buying interest hence the price closed above the MA50 line backed by a high volume. Then, there was a price correction before the price continued with the price breakout move on the previous trade. Again backed by significant volume compared with the

See all ideas
Summarizing what the indicators are suggesting.
Neutral
SellBuy
Strong sellStrong buy
Strong sellSellNeutralBuyStrong buy
Neutral
SellBuy
Strong sellStrong buy
Strong sellSellNeutralBuyStrong buy
Neutral
SellBuy
Strong sellStrong buy
Strong sellSellNeutralBuyStrong buy
An aggregate view of professional's ratings.
Neutral
SellBuy
Strong sellStrong buy
Strong sellSellNeutralBuyStrong buy
Neutral
SellBuy
Strong sellStrong buy
Strong sellSellNeutralBuyStrong buy
Neutral
SellBuy
Strong sellStrong buy
Strong sellSellNeutralBuyStrong buy
Displays a symbol's price movements over previous years to identify recurring trends.
Frequently Asked Questions
The current price of PEKAT is 1.49 MYR — it has increased by 0.68% in the past 24 hours. Watch PEKAT GROUP BERHAD stock price performance more closely on the chart.
Depending on the exchange, the stock ticker may vary. For instance, on MYX exchange PEKAT GROUP BERHAD stocks are traded under the ticker PEKAT.
PEKAT stock has fallen by −4.49% compared to the previous week, the month change is a 10.37% rise, over the last year PEKAT GROUP BERHAD has showed a 58.51% increase.
We've gathered analysts' opinions on PEKAT GROUP BERHAD future price: according to them, PEKAT price has a max estimate of 1.87 MYR and a min estimate of 1.57 MYR. Watch PEKAT chart and read a more detailed PEKAT GROUP BERHAD stock forecast: see what analysts think of PEKAT GROUP BERHAD and suggest that you do with its stocks.
PEKAT reached its all-time high on Jul 21, 2025 with the price of 1.62 MYR, and its all-time low was 0.38 MYR and was reached on May 16, 2023. View more price dynamics on PEKAT chart.
See other stocks reaching their highest and lowest prices.
See other stocks reaching their highest and lowest prices.
PEKAT stock is 5.67% volatile and has beta coefficient of 0.75. Track PEKAT GROUP BERHAD stock price on the chart and check out the list of the most volatile stocks — is PEKAT GROUP BERHAD there?
Today PEKAT GROUP BERHAD has the market capitalization of 961.00 M, it has increased by 4.90% over the last week.
Yes, you can track PEKAT GROUP BERHAD financials in yearly and quarterly reports right on TradingView.
PEKAT GROUP BERHAD is going to release the next earnings report on Aug 20, 2025. Keep track of upcoming events with our Earnings Calendar.
PEKAT net income for the last quarter is 12.06 M MYR, while the quarter before that showed 7.35 M MYR of net income which accounts for 64.09% change. Track more PEKAT GROUP BERHAD financial stats to get the full picture.
PEKAT GROUP BERHAD dividend yield was 0.00% in 2024, and payout ratio reached 0.00%. The year before the numbers were 2.33% and 46.95% correspondingly. See high-dividend stocks and find more opportunities for your portfolio.
EBITDA measures a company's operating performance, its growth signifies an improvement in the efficiency of a company. PEKAT GROUP BERHAD EBITDA is 51.54 M MYR, and current EBITDA margin is 12.78%. See more stats in PEKAT GROUP BERHAD financial statements.
Like other stocks, PEKAT shares are traded on stock exchanges, e.g. Nasdaq, Nyse, Euronext, and the easiest way to buy them is through an online stock broker. To do this, you need to open an account and follow a broker's procedures, then start trading. You can trade PEKAT GROUP BERHAD stock right from TradingView charts — choose your broker and connect to your account.
Investing in stocks requires a comprehensive research: you should carefully study all the available data, e.g. company's financials, related news, and its technical analysis. So PEKAT GROUP BERHAD technincal analysis shows the buy rating today, and its 1 week rating is buy. Since market conditions are prone to changes, it's worth looking a bit further into the future — according to the 1 month rating PEKAT GROUP BERHAD stock shows the strong buy signal. See more of PEKAT GROUP BERHAD technicals for a more comprehensive analysis.
If you're still not sure, try looking for inspiration in our curated watchlists.
If you're still not sure, try looking for inspiration in our curated watchlists.