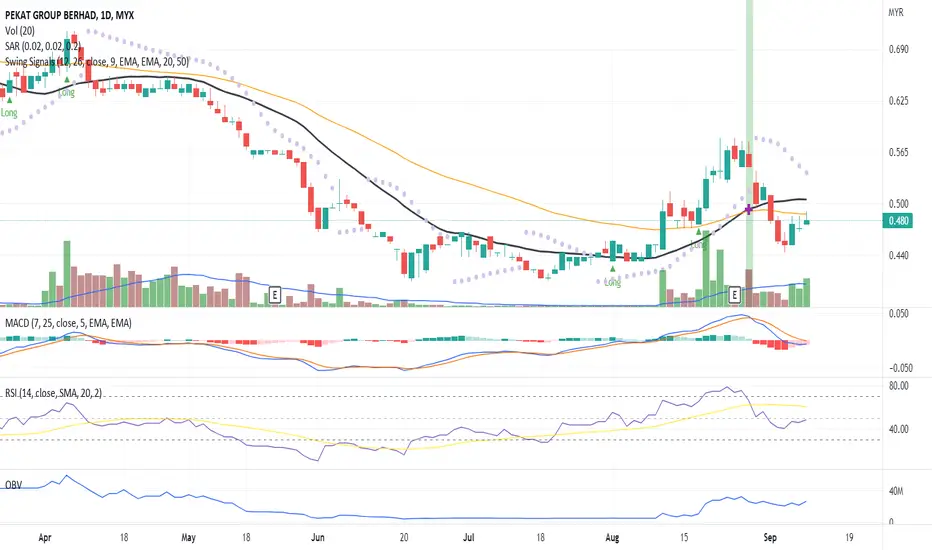
PEKAT CONT MARKING UPThis is a continuation of my prev thesis for Pekat
**Refer prev post
Since my previous position, Pekat has been always under my radar.
(This is a Stepping Stone Zone, Continuation from previous Mark Up Phase)
what caught my attention, the formation of BUEC consistenly unfolding in the background of reducing supply (red arrow)
With the formation : type #2 schematic of feather's weight (black line)
*No springboard here. difficult to see this kind of setup
although the entry point, a bit extended comparing to my average price entry, but it was still contained within the limit (not more than 2%)
Position intiated as attached
PureWyckoff
PEKAT trade ideas

PEKAT MARKING UPA Type #2 of Re-Accumulation Schematic
previous entry as attached (not too much profit secured)
Past few days noticed the BUEC (phase D)
With that in mind, possiblity starting of the campaign for phase E, which is price to mark up outside the Trading Range (BOX)
With A Trigger Bar today, position initiated with tight risk
PureWyckoff

PEKAT STOCK ROAR 2025?DEMAND WILL PLAY AROUND BOX RANGE 855-935
SUPPORT can wait 920
and will close monitor when break 1.06
it should be clearly make it higher high
and stage 2 will confirm with high volume.

PEKAT GROUP BERHAD
The price action is moving towards the upper band, which could signify the start of a short-term bullish movement if the price breaks out above the upper band.
Price Action: After a significant rally in May, the stock retraced and found support near MYR0.85. This was followed by a period of sideways movement, indicating consolidation.
Resistance: The most immediate resistance is the upper Bollinger Band, near MYR0.95. A break above this could signify a continuation of the previous uptrend.
Support: The lower Bollinger Band near MYR0.88 and a key price level at MYR0.85 serve as immediate support.
Bullish Breakout: If the price breaks above the upper Bollinger Band and volume picks up, we could see a retest of previous highs near MYR1.00 or more.
Bearish Rejection: If the stock faces resistance at the upper Bollinger Band and fails to break higher, it could retrace back to the MYR0.88-MYR0.85 support zone.
Consolidation: If the price continues to move sideways within the Bollinger Bands, expect continued consolidation with reduced volatility until a breakout occurs.
Short-term: The stock is consolidating with reduced volatility. A breakout above the upper Bollinger Band could lead to another bullish leg.
Mid-term: The trend is neutral to slightly bullish, given that the stock remains above its 20-day moving average.
Support/Resistance: Immediate support is MYR0.88, while resistance lies near MYR0.95.

PEKAT June 2024 - Update 2 : Friday Rule
Friday Rule Applies.
Last Friday , breakout new 52-WH
( but closed weak , as general market breaks below 1600 level )
continues to break new 52-WH today.

PEKAT : High tight flag , volume profile & 10WEMA , Friday Rule
prior run up >70%
breakout 10 weeks EMA
pullback to EMA10
support at VP POC and EMA10
break out new 52 weeks high today (Friday )
potential Friday Rule Candidate
also showing relative strength ( breaking out while the Market is in a correction )

PEKAT May 2024 : trading range using Fixed Volume Profile
Volume Profile showing P-Profile Characteristics
in the current consolidation zone , in the upper node of P-Profile:
- price hovers around VP POC - area of highest acceptance & trading activity
- price rejects Value Area High ( VAH ) and Value Area Low ( VAL ) - acts as support & resistance

Emerged of Buying Interest!The RSI indicates a positive outlook due to the emergence of buying interest from the previous trade. Hence pushed the price into a significant price movement backed by high volumes.
The MA13 crosses up the MA50 indicating a strong uptrend toward the next price resistance backed by the MACD indicator which indicates a divergence signal.
Let's save PEKAT in WL and watch out for significant price movement toward price resistance.
R 0.520
S 0.470

A Reversal Trend!The candlestick indicates a trend change in the price of the stock due to buying interest backed by significant volume compared with the previous trading.
The 0.475 is the price Point of Control with fresh buying interest that has emerged and is set to lift the stock higher.
MACD and OBV also indicate a divergence signal. Hence, align with the candlestick trend change of the price to the next price resistance.
The MA50 line will be the next price resistance and is worth watching out for.
Let's save PEKAT in WL and watch out for the price closed above the MA50 line backed by significant volume.
R 0.490
S 0.450
Emerged of Buying Interest!A significant price movement on 10 Aug'22 due to buying interest hence the price closed above the MA50 line backed by a high volume. Then, there was a price correction before the price continued with the price breakout move on the previous trade. Again backed by significant volume compared with the previous trading. Therefore, fresh buying interest has emerged and is set to lift the stock higher.
MACD and OBV trend lines are set to a positive uptrend due to buying interest.
Precaution since RSI is over indexer 70; becoming overbought or overvalued. It may be primed for a trend reversal or corrective price pullback.
Let's save PEKAT in WL and watch out for significant price movement with volume due to buying interest from traders.
R 0.565
S 0.460

MORNING PEKATPreviously it showed 2 times the canddle pattern can be applied for my trading plan.
For this time it shows the morning star and for comfirmation the next candle should close 0.760 or higher.
1. For short term planning can use point B as the next resistance to TP and point A level as CL.
2. Long term I use Harmonic Bat pattern for projection my trading plan.
#TAYOR MYX:PEKAT

PEKAT MelekatMengikut firasat akan menuju ke :
TP 1 : RM 0.90
TP 2 : RM 1.00
TP 3 : RM 1.14
Firasat melebur jika jatuh bawah aras RM 0.70.
