PENSONI IN HARMONIC PATTERNConsider to study and monitor Pensoni's current daily chart which resembles that of a Bullish Butterfly Harmonic Pattern where the price above Point D is deemed as the Potential Reversal Zone. The probable EP is 0.600 which is the pivot point, the probable minimum TP is 0.730, which is below Point C and also a monthly resistance and the probable CL is 0.535 which is below Point D and 52-week low. Critical resistance is 0.680 which is a yearly pivot.
This is not an investment or trade call but for study and sharing purposes only. Trade at your own risk.
PENSONI trade ideas

A Rebound From Support Line!Using Fibonacci as a guideline, the price already rebounds from the lowest level price. Hence, it is in Reversal Pattern. OBV chart showing a Divergence signal but the MACD chart is still in a negative signal. Put in your WL and watch out for significant price movement.
R 0.720
S 0.680

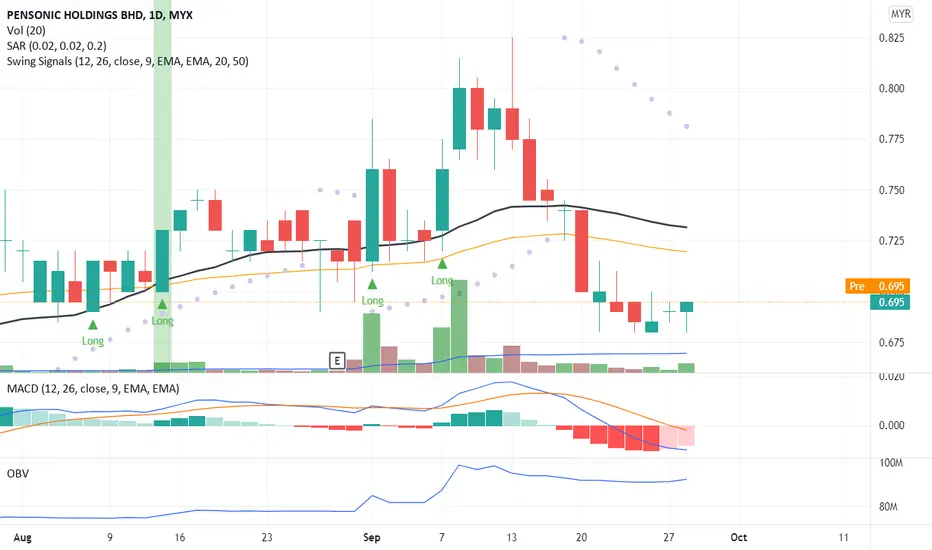
In A Sideway Pattern!PENSONIC chart is in a Sideway Pattern when the price is within a fairly stable range without forming any distinct trends over some period of time. OBV chart shows positive momentum. But MACD is still in negative momentum. Put in your WL and watch out for a significant price movement to form a Break-Out signal. And closely monitor MACD and OBV charts to confirm a divergence signal.
R 0.715
S 0.675
PENSONI VCP SETUPOverall VCP for PENSONI is crispy. The contraction and volume relationship looks promising.
C1: -28%
C2: -8%
C3: -7%
C4: -6%
C5: -5%
Recent September volume enter breakout the previous pivot.
Will it continue to attack higher? Let's see!
Disclaimer:
Not a buy call suggestion, just my sharing on technical analysis and chart pattern based on my trading experience. Trade at your own risk.

Is It a Confirmation Downtrend?At T6, the price has been pushed down below MA20. Is It a Confirmation Downtrend? MACD and OBV charts confirm the trend. Will it be able to bounce back?
R 0.830
S 0.740

Is it a Divergence Trend?At T5, there was a significant price push down the price to 0.75. Where less demand, people are looking to buy. Is it a Divergence Trend? MACD and OBV charts confirm there is a change of pattern to downtrend. If today trade, the price close below MA20 then it confirms a downtrend pattern.
R 0.830
S 0.740

Buy on Dip at T4!Recently trade the price at a higher level at 0.825 be it been pushed back and closed at 0.775. It shows PENSONIC still has a buying interest from the traders. PENSONIC is still in an Uptrend pattern which confirms from MACD and OBV chart.
R 0.830
S 0.740

Positive Outlook on T3!PENSONIC bounces back and resumes the Uptrend pattern at T3 with a small volume confirmed the price which is below Volume MA20. PENSONIC is still in an Uptrend pattern which confirms from MACD and OBV chart.
R 0.830
S 0.740

Downward Pullback on T2!It is common for a stock to have Downward Pullback or Retracement from recent peaks that occur within a continuing uptrend. Congrats to traders who entering at T0 and make a profit at T1 or T2.
In PENSONIC scenario, the Pullback or Retracement is without high pricing drops and large volume. PENSONIC is still in an Uptrend pattern which confirms from MACD and RSI chart.
Will PENSONIC will bounce back and resumes the Uptrend pattern at T3?
R 0.830
S 0.740

Is PENSONIC Able to Keep Up the Momentum in T2?T0 showing an Engulfing Candle. An indicator showing buyers push the price high. At T1, the buyer takes the position and closes the price higher a large volume compared with T0. Is PENSONIC Able to Keep Up the Momentum in T2?
R 0.830
S 0.740


PENSONI [8 December 2020] Buy On Dip in Support ZoneMYX:PENSONI
SWING: 2 DAYS TO 2 WEEKS
Breakout Downtrend Line
52 Weeks High Line
Fibbonaci Retracement
Candlestick Support & Resistant Zone
Trendline Support & Resistant

Long in DTFthe price currently consolidate in triangle pattern maybe creating flag pattern.
this can be seen the volume in consolidation is getting lower and price playing in range.
The price also retrace really good in 0.618 fibo and going up again indicating the buyer still intact.
to enter, wait the macd cross (currently in +ve) and break resistant (high volume need to be considered)

Pensoni, another selling rice cooker during MCOMay be it is true...the effect after MCO. Could it be another Milux?
I you like my chart, just give me a LIKE, follow me and share it to your friend. :)
Disclaimer: I am not Investment guru. Every stock analysis are purely for my personal learning and practice purpose.
It is not for any buy or sell call to anyone. Everyone are responsible at your own trades.
