Uptrend at weekly chartThe technical chart shows an upward trend where I have identified 4 important points to identify an upward trend which is L-H-HL-HH... So, in my opinion, this counter has the potential to go higher. Do your own fundamental research. This analysis is only based on technical analysis only. T-A-Y-O-R
PTRANS trade ideas

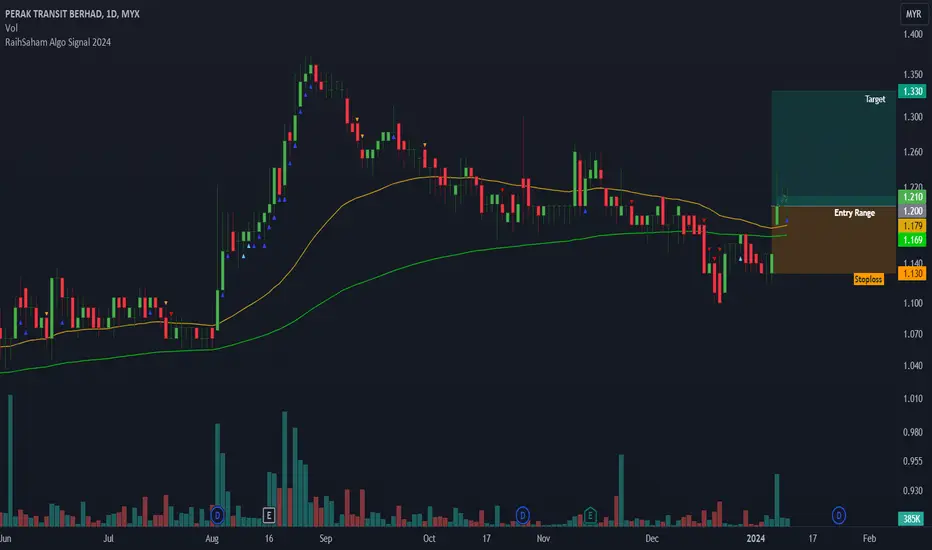
PTRANS,, Uptrend based on AlgoSignal StrategyThe current point exhibits promising upward signals according to my algorithmic system, meeting various criteria. These include rising trading volume, an upward trend indicated by prices above EMA20 and EMA50, and the closing price surpassing VWAP. As a result, the present conditions suggest a potential upward trend.
Weekly & Daily analysis on PERAK TRANSIT BERHADThis is based on weekly and daily analysis.
If you're buying, green zone is the TP
If you're selling, red zone is the TP
Monitor for price reaction at every zone, either the candle reaction in the zone want to breakout the zone, or the candle reaction want to test/pullback at the zone.
All the best.


Emerged of Buying Interest with Least Result!The candlestick pattern indicates an accumulation phase where the price is within the trendline limit. A significant price movement effort is an attempt to price break out with the least result in volume compared to the previous trade. Where the volume doesn't exceed the MA line.
The MACD and RSI indicators indicate a positive pattern and align with significant price movement with the least in volume.
Let's put PTRANS in WL and watch out for price movement with results in volume compared with the previous trade.
R1 1.25, R2 1.35
S1 1.00, S2 0.85

PVA + OBV Analysis on PTRANS1. Price getting lower and the EMA200 for now managed to held the support.
2. Bullish divergence in RSI
3. Bullish divergence in OBV
4. Potential play :
a) Wait for price to close the gap
b) Go long with 3:1 ratio or 5:1 ratio

Ptrans: ATH#PTRANS (CASE STUDY BY STUDENTS)
Basic Swap zone
TP1: 1.32-1.35.
Invalidation level: 1.12.
Lets monitor closely!
*Personal opinion trade at your own risk*

Gaining Uptrend Momentum!The price gained momentum after crossing over the MA20 line backed by volume due to fresh buying interest on the stock. This will be the beginning of a price rally towards the next price resistance.
MACD and OBV indicate a divergence signal, thus, confirming the price momentum towards the next price resistance.
To place a bid, use VWAP as a guideline then place the bid below the VWAP line. Because the price Point of Control (PoC) is the same as the closed price. Therefore, higher risk for a long trade position.
Let's save PTRANS in WL and watch out for the significant price movement backed with volume or the MA50 line crossing the MA20 line, hence, indicating a strong uptrend momentum.
R 0.925
S 0.875

PTRANS awaiting breakoutPTRANS i first traded during 27 Jun when the price breakout from VCP with contraction below:
C1: -9%
C2: -7%
C3: -3%
On 15 Jul, huge candle price range with volume trigger me to execute sell out. Got >12% reward through this trade.
I still keep monitoring the price/volume interaction after sell out. Recent volume development is good.
25,26,29 Aug indicate 3 white soldier candle. Awaiting a solid candle breakout!
Disclaimer:
Not a buy call recommendation. Just my personal technical analysis based on chart pattern. Trade at your own risk.

PTRANSPrice tightening near the EMA 20.
Buy Signal: Price breaks the tight area with a significant amount of volume

PTrans..BODTLbreakout downtrendline
volume coming?
nice accumulation area in trading range
sentiment play

PTRANS : correction soon?Base on weekly and monthly charts, it may reach the top.
Week chart : rejection is forming.
Not suitable to hold long.
If FIFO, look for better enter price.
There is no guarantee that price will fall / up tmr. It's all abt probability & sharing is purely on TA charting candlestick pattern only.
DYODD & TAYOR


PTRANS IN BULLISH HARMONIC PATTERNConsider to study and monitor PTRANS' current chart which resembles that of a bullish bat harmonic pattern, where above Point D is deemed as the Potential Reversal Zone (PRZ). The probable EP is 0.605 to retest a 4htf pivot point. The probable TP could be at least 0.715, the same level as Point C and also a yearly pivot resistance. The probable CL is 0.545 below point A and 52-week low. This is not an investment or trading call, but only for study and sharing purposes only. If one wishes to invest or trade, trade at your own risk.

VCP SETUP PTRANSIncreasing QOQ and YOY sales and profits.Still in downtrend,however could be turnaround company if it makes a breakout of a base (box) with high volume and maintain above 200MA

<TradeVSA> Strong Reversal in PTRANS. More to Come ?Sign of Strength in the chart:
1. High volume reversal
2. Triple NS above 20/40ma
3. Green Pentagon
Disclaimer
This information only serves as reference information and does not constitute a buy or sell call. Conduct your own research and assessment before deciding to buy or sell any stock

A Breakout Signal!With significant price movement on a recent trade, PTRANS is showing a Breakout (BO) signal. MACD and OBV charts indicate a divergence signal. Therefore, high probability the price can hit the next resistance of 0.72. Put in your WL and watch out for significant price on upcoming trade.
R 0.720
S 0.660

PTRANS (BURSA WK41 2021)The price has consolidated approx. 1 month since 7th of Sept, breakout with high volume.
Target profit as 0.75 if the trend can breakout 0.72 and 0.735.
MACD and Stochastic also have appeared bull trend signal previously.
=====================================================================================================
I am a profitable trader, here is the watch-list for Bursa Malaysia Market.
-TGL Engineered Excellence-

PTRANS BULLISH BAT PATTERNTargeted price is Fibo retracement point C to point D within 0.382% to 0.618%.
#TAYOR MYX:PTRANS

<TradeVSA> PTRAN - Reversal with NS SignalSign of Strength in the chart:
1. High volume reversal
2. Tested 20/40ma with NS signal
Disclaimer
This information only serves as reference information and does not constitute a buy or sell call. Conduct your own research and assessment before deciding to buy or sell any stock

PTRANS reversal pattern and strong volume to break the downtrendCould this be the reversal pattern that we have been looking for?
- 3 black crows with 3 white soldiers indicate the strong reversal pattern
- price and big volume trying to break the downtrend line

PTRANS - Double BottomRevisting a past stock, recently broke triangle and caused a selldown. Seems to have found a double bottom support. Possible rebound to EMA 50 / 200 Good risk reward.

Semua Mahukan SpringSpring jadi ke tak? kalau jadi heading back into TR,
Making series of LPS
Break R showing SOS
Retrace back to LPS
If ok then lets markup!
