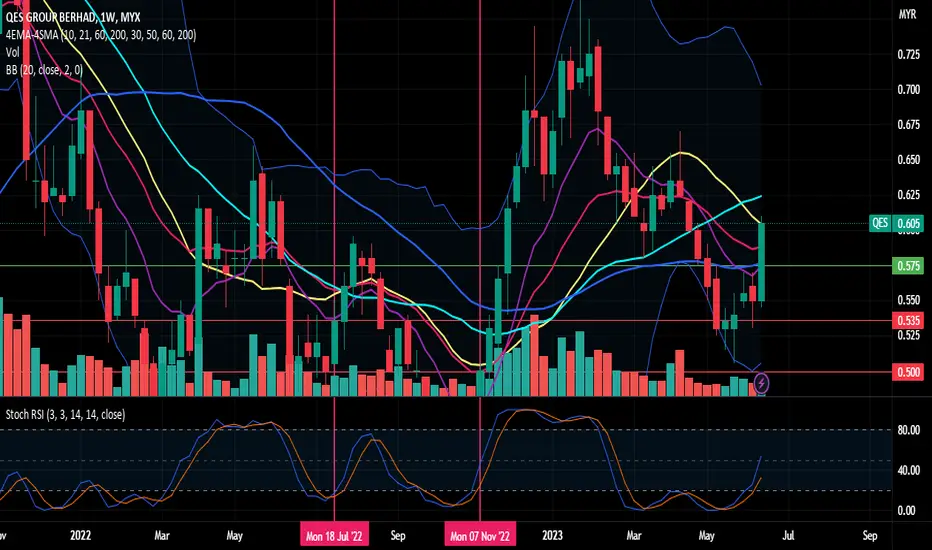
QES, The current point exhibits upward signals according to my algorithmic system, meeting various criteria. These include rising trading volume, an upward trend indicated by prices above EMA20 and EMA50, and the closing price surpassing VWAP. As a result, the present conditions suggest a potential upwa
Next report date
—
Report period
—
EPS estimate
—
Revenue estimate
—
0.020 MYR
17.32 M MYR
269.58 M MYR
609.99 M
About QES GROUP BERHAD
Sector
Industry
CEO
Ne Weng Chew
Website
Headquarters
Shah Alam
Founded
1991
ISIN
MYQ0196OO004
FIGI
BBG00K0FBGT2
QES Group Bhd. is an investment holding company, which engages in the provision of distribution, manufacturing, and engineering services. It operates through the following four segments: Investment Holding, Equipment, Materials and Engineering Solutions, and Manufacturing. The Investment Holding segment refers to the management in shares. The Equipment segment is involved in the marketing and servicing of scientific instruments. The Materials and Engineering Solutions segment includes the trading and servicing of industrial parts, equipment, and scientific instruments. The Manufacturing segment focuses on trading and servicing of industrial parts, equipment, and vision software solution. The company was founded by Ne Weng Chew in October 4, 1991 and is headquartered in Shah Alam, Malaysia.
Related stocks

QESQES (0196): Listed on the Main Board; Industrial Products & Services, Semiconductor-related.
The stock is trading above the MA200 after a minor breakout at RM0.59. The current price is above the green transition Ichimoku Kijun line. The MACD indicates a golden cross. Both the Stochastic and RSI are

QES: Support in Trend LineBest EP: 0.60
TP : 0.66
QES on fullback phase, support on trendline, based on fibo it can go until FIB 1.0 (0.66)
InsyaALLAH

QES Resistance BreakoutToday, the stock break the resistance with large volume. Then, based on weekly chart, the price also break MA20 and MA50 which is a good sign. Not only that, the stock just moving up from oversold region. Technically, I think this stock may go higher.
QES: NEAR SUPPORTQES (CASE STUDY)
Fresh demand zone 0.62-0.64, potential support HL. monitor price action when price mitigate the zone. if price breaks below 0.62, monitor next demand zone .
*Personal opinion, trade at your own risk*

QES Simple Chart AnalysisQES - We can see red chip started to react these few days as QR yet to be announce. So is clear that price had been factor in before the release which i assume will be continue once global rally start to move.
A strong support being form at 0.4 area along with a double bottom pattern. 0.49 can be


Momentum building upQES has bucked eight straight months of market pullback, however, the share has rebounded upon touching Fibonacci level 61.8 coincides with reversal inverted head and shoulder pattern somewhere in March. The share subsequently has broken above resistance turns support level at 0.545 with bullish bia

qessimple idea how to trade trending counter
use smaller time frame
don't target tp so high
but still must follow good MM
entry when signal appear

QES 3.4.2022QES
Market structure cantik
dah create HH, HL, HH
so boleh cari entry point. be brave. to take a risk.
wherever entry point, there risk alwiz there.
so, try minimize ur risk and maximze ur profit.
trade as planned.

See all ideas
Summarizing what the indicators are suggesting.
Neutral
SellBuy
Strong sellStrong buy
Strong sellSellNeutralBuyStrong buy
Neutral
SellBuy
Strong sellStrong buy
Strong sellSellNeutralBuyStrong buy
Neutral
SellBuy
Strong sellStrong buy
Strong sellSellNeutralBuyStrong buy
An aggregate view of professional's ratings.
Neutral
SellBuy
Strong sellStrong buy
Strong sellSellNeutralBuyStrong buy
Neutral
SellBuy
Strong sellStrong buy
Strong sellSellNeutralBuyStrong buy
Neutral
SellBuy
Strong sellStrong buy
Strong sellSellNeutralBuyStrong buy
Displays a symbol's price movements over previous years to identify recurring trends.
Frequently Asked Questions
The current price of QES is 0.410 MYR — it has increased by 1.23% in the past 24 hours. Watch QES GROUP BERHAD stock price performance more closely on the chart.
Depending on the exchange, the stock ticker may vary. For instance, on MYX exchange QES GROUP BERHAD stocks are traded under the ticker QES.
QES stock has risen by 1.23% compared to the previous week, the month change is a 9.33% rise, over the last year QES GROUP BERHAD has showed a −38.81% decrease.
We've gathered analysts' opinions on QES GROUP BERHAD future price: according to them, QES price has a max estimate of 0.42 MYR and a min estimate of 0.40 MYR. Watch QES chart and read a more detailed QES GROUP BERHAD stock forecast: see what analysts think of QES GROUP BERHAD and suggest that you do with its stocks.
QES stock is 3.75% volatile and has beta coefficient of 1.37. Track QES GROUP BERHAD stock price on the chart and check out the list of the most volatile stocks — is QES GROUP BERHAD there?
Today QES GROUP BERHAD has the market capitalization of 337.83 M, it has decreased by −1.25% over the last week.
Yes, you can track QES GROUP BERHAD financials in yearly and quarterly reports right on TradingView.
QES GROUP BERHAD is going to release the next earnings report on Aug 26, 2025. Keep track of upcoming events with our Earnings Calendar.
QES net income for the last quarter is 916.00 K MYR, while the quarter before that showed 7.21 M MYR of net income which accounts for −87.29% change. Track more QES GROUP BERHAD financial stats to get the full picture.
QES GROUP BERHAD dividend yield was 0.92% in 2024, and payout ratio reached 26.44%. The year before the numbers were 0.98% and 22.62% correspondingly. See high-dividend stocks and find more opportunities for your portfolio.
As of Jul 31, 2025, the company has 485 employees. See our rating of the largest employees — is QES GROUP BERHAD on this list?
EBITDA measures a company's operating performance, its growth signifies an improvement in the efficiency of a company. QES GROUP BERHAD EBITDA is 45.91 M MYR, and current EBITDA margin is 16.44%. See more stats in QES GROUP BERHAD financial statements.
Like other stocks, QES shares are traded on stock exchanges, e.g. Nasdaq, Nyse, Euronext, and the easiest way to buy them is through an online stock broker. To do this, you need to open an account and follow a broker's procedures, then start trading. You can trade QES GROUP BERHAD stock right from TradingView charts — choose your broker and connect to your account.
Investing in stocks requires a comprehensive research: you should carefully study all the available data, e.g. company's financials, related news, and its technical analysis. So QES GROUP BERHAD technincal analysis shows the buy rating today, and its 1 week rating is sell. Since market conditions are prone to changes, it's worth looking a bit further into the future — according to the 1 month rating QES GROUP BERHAD stock shows the sell signal. See more of QES GROUP BERHAD technicals for a more comprehensive analysis.
If you're still not sure, try looking for inspiration in our curated watchlists.
If you're still not sure, try looking for inspiration in our curated watchlists.