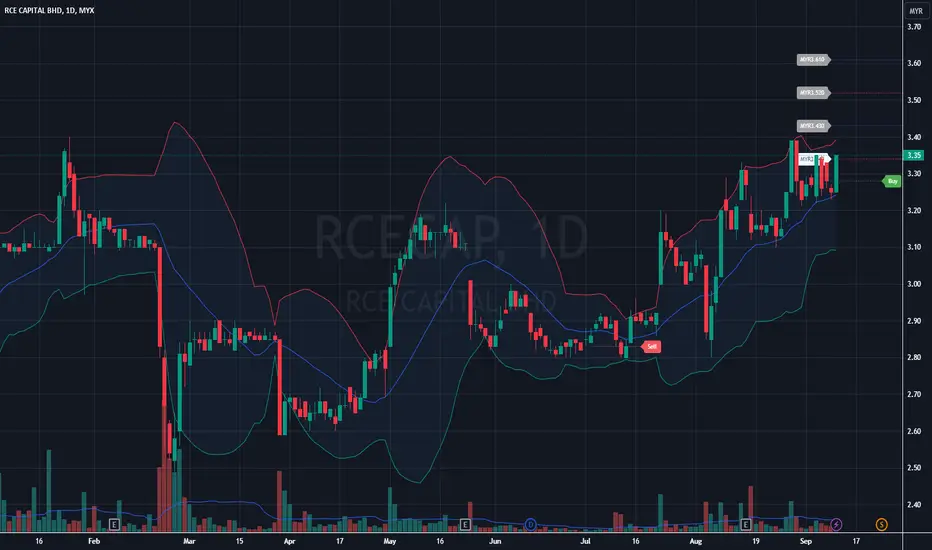
RCECAP : Short Term Stock Trading 3 Reason to Trade this stock
Good Fundamentals Stock
Trading in horizontal support zone & parallel uptrend
Continues business growth since 2015
Short Term holding ( 3 months )
Expect for 12.34 % capital gain
Record Holding
30 lots stock holding
Next report date
—
Report period
—
EPS estimate
—
Revenue estimate
—
0.07 MYR
105.54 M MYR
367.91 M MYR
484.63 M
About RCE CAPITAL BHD
Sector
Industry
CEO
Kam Chuin Loh
Website
Headquarters
Kuala Lumpur
Founded
1953
ISIN
MYL9296OO004
FIGI
BBG000C1WGB0
RCE Capital Bhd. is an investment holding company, which engages in the provision of general financing services. It is also involved in providing shariah-compliant financing solutions to civil servants with the objective of providing sustainable return to stakeholders. The company was founded on December 18, 1953 and is headquartered in Kuala Lumpur, Malaysia.
Related stocks

RCECAP - Consolidate + H&S chart pattern
RCECAP - Consolidate since Feb 2024, making higher high all the time, H&S complete at RM1.69 if not drop the price lower than RM1.60. Entry RM1.66, SL RM1.60, Risk 3.6%, TP (Profit 10%) RM1.80. However, RM1.90 can take 80% profit 1st
Hope my analysis is correct.

The short-term trend appears to be upwardBollinger Bands :
Middle Band: The price is above the middle band, suggesting bullish momentum in the short term.
Volume :
Recent volume is lower but steady, which shows no excessive buying or selling pressure.
Price Action :
Currently, the price is consolidating in a sideways rang
RCECAP, gap to close?Still under selling pressure at this moment.
Daily RSI, Stochastic are oversold.
1h : wait for stronger signal = better HL as confirmation of reversal trend / rebound. It must follow with HH and another 2nd HL.
And as usual, I will seek at least 3 confirmations. Anything less is gambling.
Disc

RCECAP - the set-up that I won't tradeWhatever at too, will down. Shall we catch the falling knife ? Some traders will, but some won't.
Over here, we unable to go for short, only can long. Know your market and trade accordingly.
>> 24th January, price start down, stochastic and RSI both are DC.
>> After that, stochastic is at OS area

RCECAP price all time high. Analysis 7.6.23RCECAP price has reached all time high. Dividend payout will be on 14.6.23 for 7cents per share. Quite a good dividend payout. Qtr report are favourable with 34.8M profits.
However, each time a dividend payout, price will drop significantly. Long term Traders can buy now to enjoy the dividends. Can

RCE Capital BHD Outlook 18/04/2022RCE Capital BHD
CMP:-1.870
After a long uptrend last week this counter is expected to continue this trend this week with some news release.
recently broke the resistance point of 1.850 and is expected if breaks the next resistance point of 1.900 will make an high of 2.000 can be considered for lon


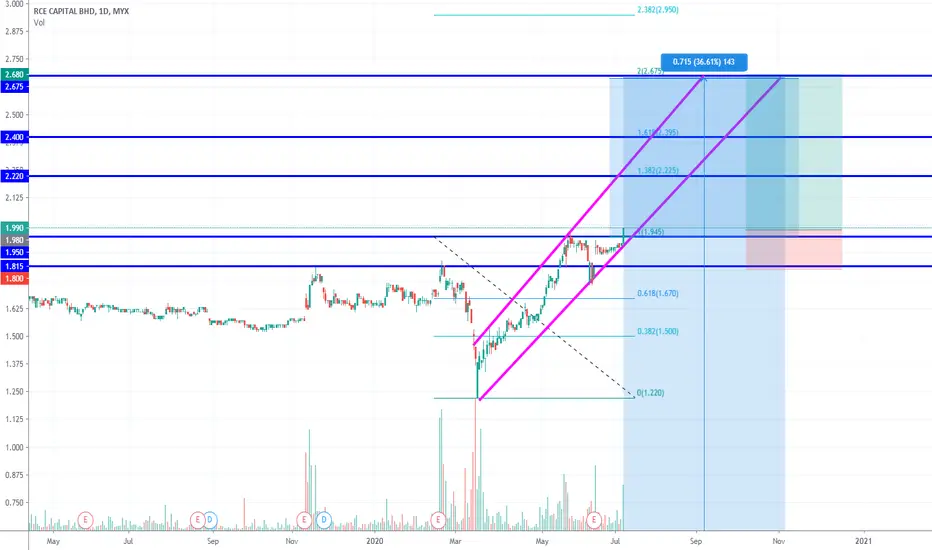
Not an exciting volume showcase yetTook almost 14 years to break this super resistance with confidence.
However, volume is not telling any exciting story. First time in these 14 years, the big spike in price is not accompanied by the volume.

RCECAPUptrend, Good FA, Breakout resistance, Risk Reward Ratio 1:4, Potential 30% return within 2 months
MYX:RCECAP is a private loan company,
5 year EPS CAGR 30%
EV/EBITDA <10
NET PROFIT MARGIN 35%
ROE 14%
PE<10
UNDERVALUE STOCK
See all ideas
Summarizing what the indicators are suggesting.
Neutral
SellBuy
Strong sellStrong buy
Strong sellSellNeutralBuyStrong buy
Neutral
SellBuy
Strong sellStrong buy
Strong sellSellNeutralBuyStrong buy
Neutral
SellBuy
Strong sellStrong buy
Strong sellSellNeutralBuyStrong buy
An aggregate view of professional's ratings.
Neutral
SellBuy
Strong sellStrong buy
Strong sellSellNeutralBuyStrong buy
Neutral
SellBuy
Strong sellStrong buy
Strong sellSellNeutralBuyStrong buy
Neutral
SellBuy
Strong sellStrong buy
Strong sellSellNeutralBuyStrong buy
Displays a symbol's price movements over previous years to identify recurring trends.
Frequently Asked Questions
The current price of RCECAP is 1.04 MYR — it has increased by 2.91% in the past 24 hours. Watch RCE CAPITAL BHD stock price performance more closely on the chart.
Depending on the exchange, the stock ticker may vary. For instance, on MYX exchange RCE CAPITAL BHD stocks are traded under the ticker RCECAP.
RCECAP stock has risen by 0.95% compared to the previous week, the month change is a −3.64% fall, over the last year RCE CAPITAL BHD has showed a −32.25% decrease.
We've gathered analysts' opinions on RCE CAPITAL BHD future price: according to them, RCECAP price has a max estimate of 1.42 MYR and a min estimate of 1.25 MYR. Watch RCECAP chart and read a more detailed RCE CAPITAL BHD stock forecast: see what analysts think of RCE CAPITAL BHD and suggest that you do with its stocks.
RCECAP reached its all-time high on Nov 11, 2024 with the price of 1.77 MYR, and its all-time low was 0.06 MYR and was reached on Dec 22, 2003. View more price dynamics on RCECAP chart.
See other stocks reaching their highest and lowest prices.
See other stocks reaching their highest and lowest prices.
RCECAP stock is 1.92% volatile and has beta coefficient of 0.67. Track RCE CAPITAL BHD stock price on the chart and check out the list of the most volatile stocks — is RCE CAPITAL BHD there?
Today RCE CAPITAL BHD has the market capitalization of 1.56 B, it has decreased by −7.08% over the last week.
Yes, you can track RCE CAPITAL BHD financials in yearly and quarterly reports right on TradingView.
RCE CAPITAL BHD is going to release the next earnings report on Aug 14, 2025. Keep track of upcoming events with our Earnings Calendar.
RCECAP net income for the last quarter is 16.63 M MYR, while the quarter before that showed 30.75 M MYR of net income which accounts for −45.92% change. Track more RCE CAPITAL BHD financial stats to get the full picture.
RCE CAPITAL BHD dividend yield was 4.89% in 2024, and payout ratio reached 90.28%. The year before the numbers were 5.60% and 79.20% correspondingly. See high-dividend stocks and find more opportunities for your portfolio.
As of Aug 4, 2025, the company has 219 employees. See our rating of the largest employees — is RCE CAPITAL BHD on this list?
EBITDA measures a company's operating performance, its growth signifies an improvement in the efficiency of a company. RCE CAPITAL BHD EBITDA is 170.23 M MYR, and current EBITDA margin is 46.50%. See more stats in RCE CAPITAL BHD financial statements.
Like other stocks, RCECAP shares are traded on stock exchanges, e.g. Nasdaq, Nyse, Euronext, and the easiest way to buy them is through an online stock broker. To do this, you need to open an account and follow a broker's procedures, then start trading. You can trade RCE CAPITAL BHD stock right from TradingView charts — choose your broker and connect to your account.
Investing in stocks requires a comprehensive research: you should carefully study all the available data, e.g. company's financials, related news, and its technical analysis. So RCE CAPITAL BHD technincal analysis shows the sell today, and its 1 week rating is strong sell. Since market conditions are prone to changes, it's worth looking a bit further into the future — according to the 1 month rating RCE CAPITAL BHD stock shows the sell signal. See more of RCE CAPITAL BHD technicals for a more comprehensive analysis.
If you're still not sure, try looking for inspiration in our curated watchlists.
If you're still not sure, try looking for inspiration in our curated watchlists.