RCECAP : Short Term Stock Trading 3 Reason to Trade this stock
Good Fundamentals Stock
Trading in horizontal support zone & parallel uptrend
Continues business growth since 2015
Short Term holding ( 3 months )
Expect for 12.34 % capital gain
Record Holding
30 lots stock holding
RCECAP trade ideas

RCECAP - Consolidate + H&S chart pattern
RCECAP - Consolidate since Feb 2024, making higher high all the time, H&S complete at RM1.69 if not drop the price lower than RM1.60. Entry RM1.66, SL RM1.60, Risk 3.6%, TP (Profit 10%) RM1.80. However, RM1.90 can take 80% profit 1st
Hope my analysis is correct.

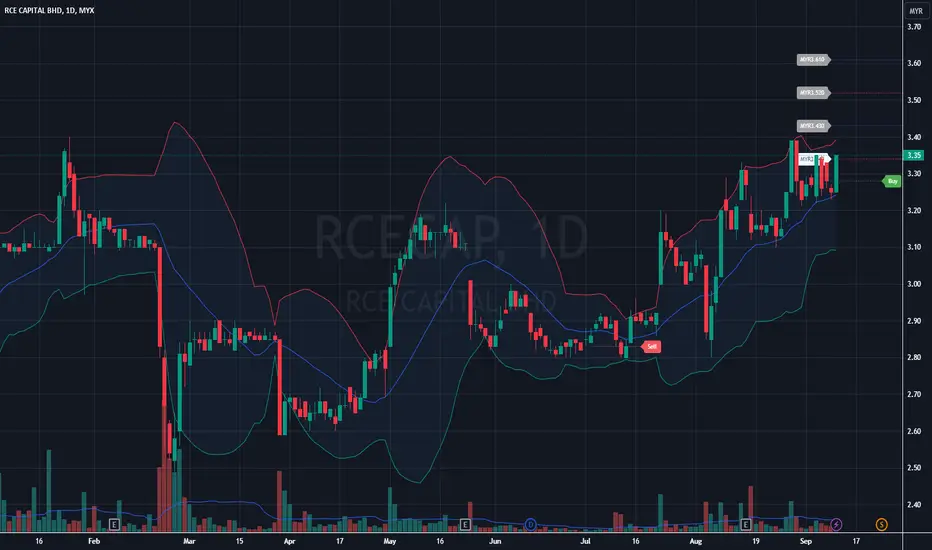
The short-term trend appears to be upwardBollinger Bands :
Middle Band: The price is above the middle band, suggesting bullish momentum in the short term.
Volume :
Recent volume is lower but steady, which shows no excessive buying or selling pressure.
Price Action :
Currently, the price is consolidating in a sideways range after the latest upward move, which may indicate a potential breakout or pullback.
Conclusion :
Bullish Bias: The price is trending upwards with support from the moving average, and it's currently near the upper Bollinger Band, so some profit-taking might occur soon.
Watch for Breakout: If the price breaks above the recent high (~3.40), there could be a continuation of the uptrend. However, if the price fails to sustain and drops below the middle Bollinger Band or the moving average, a pullback or correction could follow.
RCECAP, gap to close?Still under selling pressure at this moment.
Daily RSI, Stochastic are oversold.
1h : wait for stronger signal = better HL as confirmation of reversal trend / rebound. It must follow with HH and another 2nd HL.
And as usual, I will seek at least 3 confirmations. Anything less is gambling.
Disclaimer :
Please be informed that all stocks pick are solely for education and discussion purpose; it is neither a trading advice nor an invitation to trade. For trading advice, please speak to your remisier or dealer representative.

RCECAP - the set-up that I won't tradeWhatever at too, will down. Shall we catch the falling knife ? Some traders will, but some won't.
Over here, we unable to go for short, only can long. Know your market and trade accordingly.
>> 24th January, price start down, stochastic and RSI both are DC.
>> After that, stochastic is at OS area for couple days (until now). Some will argue that it's good to collect OS because it's at bottom. But bear in mind that Oversold will continue Oversold, and vice versa.
>> Hull MA is red, and price hardly sustaine above the Hull MA.
>> Currently price slightly above EMA 200, but as mentioned above, and it doesn't show any firm reversal yet.
Look for your own setup to trade, because only ourself can fully understand what the chart telling us.
When a stock / index has gone up substantially, we must be more care if we decide to get involve in it...
monitor closely and be agile....
we cannot PREDICT what definitely will happen ~ we can only RESPONSE to what we see!
Disclaimer: Mentioned stocks are solely based on own opinions for education and/or discussion purpose only. There's no buy and/or sell recommendation. Trading involve financial risk on your own. The author shall not be responsible for any losses or lost profits resulting from investment decisions based on the use of the information contained herein.

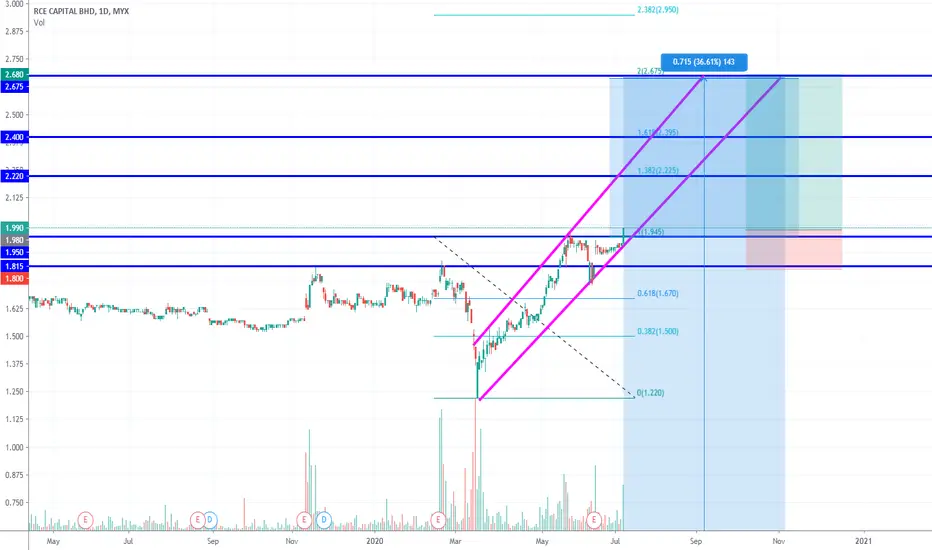
RCECAP price all time high. Analysis 7.6.23RCECAP price has reached all time high. Dividend payout will be on 14.6.23 for 7cents per share. Quite a good dividend payout. Qtr report are favourable with 34.8M profits.
However, each time a dividend payout, price will drop significantly. Long term Traders can buy now to enjoy the dividends. Can average down if price drops.
Short term trader, can wait until price retrace to reverse Fib 0.618 at price RM 1.94 or reverse Fib 0.382 at price RM 1.79. This is further confirmed with bearish harami candlestick on 7.6.23.
However I would wait until the dividend ex date payout to see how the market react before gives an entry.
This is not a buy/sell call. Please DYOR before give any entry.
- Nares-

RCE Capital BHD Outlook 18/04/2022RCE Capital BHD
CMP:-1.870
After a long uptrend last week this counter is expected to continue this trend this week with some news release.
recently broke the resistance point of 1.850 and is expected if breaks the next resistance point of 1.900 will make an high of 2.000 can be considered for long term buying
The Relative strength index (RSI) is at 78.03


Not an exciting volume showcase yetTook almost 14 years to break this super resistance with confidence.
However, volume is not telling any exciting story. First time in these 14 years, the big spike in price is not accompanied by the volume.

RCECAPUptrend, Good FA, Breakout resistance, Risk Reward Ratio 1:4, Potential 30% return within 2 months
MYX:RCECAP is a private loan company,
5 year EPS CAGR 30%
EV/EBITDA <10
NET PROFIT MARGIN 35%
ROE 14%
PE<10
UNDERVALUE STOCK
RCECAP - Bullish Breakout with Widening BBRCECAP
Trend: Bullish
Rst: 1.78/ 1.85
Spp: 1.73
Bullish breakout with widening BB, and the bullish crossover in MACD will bring further trading interest. This stock can trend higher. Only concern is low liquidity.

RCE CAP BHD (Bullish Still)View On RCE CAP BHD(25 Feb 2019)
It is in a decent bull trend and it shall "easily" retouch 1.715 again. The other tgts are 1.775 and 1.855.
So far, we do not see signs of bearishness just yet.
DYODD, all the best and read the disclaimer too.
Feel Free to "Follow", press "LIKE" "Comment".
Thank You!
Legal Risk Disclosure:
Trading foreign exchange or CFD on margin carries a high level of risk, and may not be suitable for all investors.
The high degree of leverage can work against you as well as for you.
Before deciding to trade foreign exchange you should carefully consider your investment objectives, level of experience and risk appetite.
The possibility exists that you could sustain a loss of some or all of your initial investment and therefore you should not invest money that you cannot afford to lose. You should be aware of all the risks associated with foreign exchange trading, and seek advice from an independent financial advisor.
DISCLAIMER:
Any opinions, news, research, analyses, prices or other information discussed in this presentation or linked to from this presentation are provided as general market commentary and do not constitute investment advice.
Sonicr Mastery Team does not accept liability for any loss or damage, including without limitation to, any loss of profit, which may arise directly or indirectly from use of or reliance on such information.
