REVENUE, QR soon. Where's the next direction?Downtrend started since April 2021 until now, and those EP wrong should be hardly to recovery.
What now?
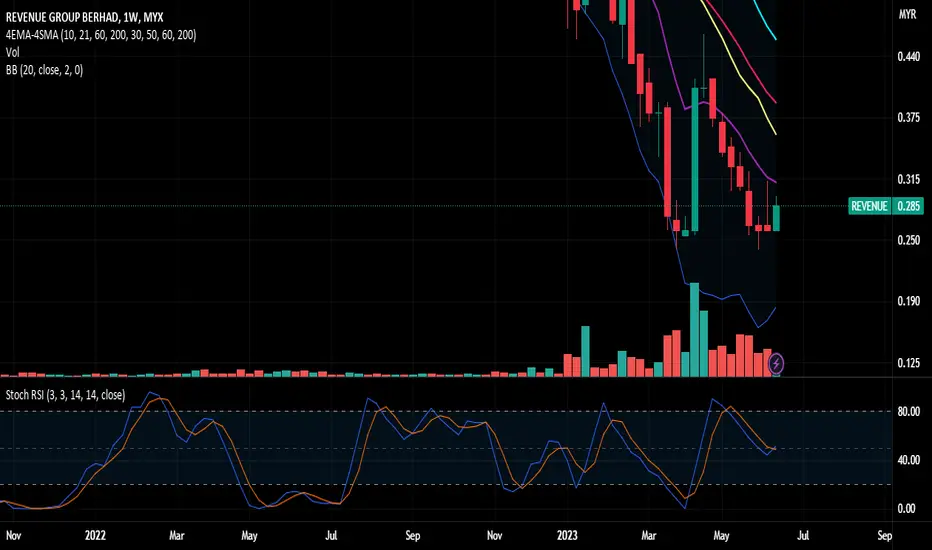
>> Price below Hull MA
>> Need to break the short-term downtrend line (pink) if want continue short term rally.
>> Last support 0.185
>> 0.215 ~ 0.225 is R area.
>> Stochastic is OS.
Personally won't take this trade.
Buy and sell so you can sleep better at night. But if you lose your sleep after you buy or sell. Then have to evaluate why you buy or sell....🤔
Disclaimer: Mentioned stocks are solely based on own opinions for education and/or discussion purpose only. There's no buy and/or sell recommendation. Trading involve financial risk on your own. The author shall not be responsible for any losses or lost profits resulting from investment decisions based on the use of the information contained herein.
REVENUE trade ideas

Revenue - will operator push it?Overall price is below all the EMA lines, indicators at OS (oversold) area.....
Do you realise price is hardly move when it below lines and/or at OS area?
Will operators push such stock?
Think again when it breakout (downtrend line or at OB (overbought) area. So, skip for this moment.
Disclaimer: Mentioned stocks are solely based on own opinions for education and/or discussion purpose only. There's no buy and/or sell recommendation. Trading involve financial risk on your own. The author shall not be responsible for any losses or lost profits resulting from investment decisions based on the use of the information contained herein.

REVENUE : "Breakout filter" Filter 1 Filter 1: Price & Volume Breakout (Default symbol: Tiny Yellow Triangle)
Filter 1 focuses on identifying breakouts based on both price and volume criteria. It considers the following conditions:
- Price Breakout: The close price crosses above the Donchian Channel's middle line, indicating a potential upward breakout.
- Volume Breakout: The trading volume exceeds the moving average of volume, suggesting increased market participation during the breakout.
When both the price breakout and volume breakout conditions are met, Filter 1 generates a signal indicating a potential breakout in the market. This filter helps traders identify significant price movements accompanied by higher trading volumes.


REVENUE Forming Double BottomBased on weekly chart, the stock is forming a double bottom pattern. We can see, there is a rebound in this week. Not only that, todays movement pattern quite the same as in 12 April 2023, if we look on daily chart. Therefore, this stock might have a chance to have a successful upward movement.
REVENUE @ very strong support zone. 29/May/23Revenue possible already completed its an expanding flat (A)(B)(C)(Cyan) pattern with pullback now @ strong demand zone.

Revenue possible found its “base” @ 0.185 +/-. 27/March/23.Revenue is forming an expanding flat (A)(B)(C)(Cyan) ..where wave (C) (Cyan) could reach @ 0.185 +/-..

Revenue : 100m run is coming soon?Let's the picture tell us the next move.
Grab some popcorn 🍿 and enjoy the show.
Disclaimer:
Mentioned stocks are solely based on own opinions for education/discussion purpose only.

REVENUE SPOTTED IN VOLATILITY REVERSALRevenues has been spotted to have reversed its downward trend as indicated by the volatility gauge and flow.

REVENUE 4.4.2022Revenue
When to buy
just follow urtrend
this only idea for trading
and how to interpreted chart reading
sometimes POpit some LOss.
MAke sure CL immediately once reach ur CL level


REVENUE SPOTTED IN DOUBLE BOTTOM FORMATIONREVENUE double-bottom spotted. Proposed EP is 1.580 to retest the neckline. The TP and CL are depicted in the potential trading plan.

REVENUE - 3M indicator + TA8/9/21
A beautiful chart that is just up to my liking. Although, I would like it better if there's any trend pattern that I can refer to for a confidence booster 😆
Indicator: 3M, CS breakout MA20
Strategy: BOD
Support 1: 1.960 (VERY STRONG)
Support 2: 1.940
Resistance 1: 1.990
Resistance 2: 2.040
EP: 1.960
SL: 1.930
TP: 2.040

REVENUE VCP SETUPREVENUE developing VCP since April.
C1: -27%
C2: -13%
C3: -3%
I believe C3 still need develop for awhile before it fully attack.
Lately e-payment/wallet sector seems brewing. GHL and MPAY also developing VCP pattern. I do shared MPAY VCP in one of my previous post.
Let's see how this sector go.
Disclaimer:
Not a buy call, just technical chart analysis sharing. Trade at your own risk.

REVENUE - Strong Bulls Strength Within ConsolidationNO INVESTMENT ADVICE IS PROVIDED
DISCLAIMER
Please consider your own interpretation of Opportunity & Risk. The author of this post strictly follows the Malaysian Security Commission ( SC ) Guidelines on the prohibition of Investment Advice by unlicensed parties. Any examples shall use historical charts without any recommendations and not to cause inducement to the public to take action or position (e.g. buy, sell or hold) regarding a particular class, sector, or instrument in relation to securities or derivatives. The author will never provide any investment or trading advice as the activity of giving investment advice is likely to be considered as a regulated activity under the Capital Markets and Services Act 2007 ( CMSA ). All posts made in Tradingview do not include any communications involving providing recommendations or opinions or includes any material, content or any statement which are likely to induce a person to take any action or position (e.g. buy, sell or hold) regarding a particular class, sector, or instrument in relation to securities or derivatives that is likely to be considered as “advising others concerning securities or derivatives”. The author will not recklessly make any statement, promise or forecast that is misleading, false or deceptive to induce or attempt to induce another person to deal in securities or derivatives. None of information posted in post can be used as investment decisions. Do not trade solely on the information posted. Trade at your own risk and judgement. A trader could potentially lose all money. Only risk capital that can be lost without jeopardizing ones financial security of lifestyle. Please seek licensed professional guidance if you plan to invest your capital seriously.

REVENUE - Seeking New SupportREVENUE
Theme: Payment solution
Rst: 2.30
Spp: 2.23
Still way bullish, only concern is RSI bearish divergence is plaguing the momentum now. If coming candles manage to forge new support above 2.23 area, there’s tendency to see the bearish signal being neutralised

Revenue Bearish Divergence?MYX: Revenue
Bearish divergence?
Price up with small volume
Fift decresing
Red Bar 90%
SL: 2.115

Revenue Group BerhadIt has already reached 2.275 the target TP for this long. Well, it may go higher.
If tomorrow's candle is a bearish candle then it is possible that it is time for a retracement.
eyes on 0.5% = 2.125 and
eyes on 0.786% = 2.000
We will work it out after it has reached one of those level.
No trades on our side.

REVENUE ASCENDING TRIANGLE VCP PATTERNMYX:REVENUE
REVENUE ASCENDING TRIANGLE VCP PATTERN
UPTREND
FiFT +VE RECHARGE +
MCDX+ BANKER 61%
TREND EXPERT TRENDING

#Revenue DTF - Fibonacci Strategy Trading Plan - Going to completed the major wave no 3 at 161.80% or above


REVENUE - Likely to See Weakness TomorrowREVENUE
Theme: Payment solution
Rst: 1.90
Spp: 1.82
Violation of candlestick into falling wedge formation again, plus pressure from RSI and MACD second bearish crossover may induce further selling in coming days. Likely to see weakness towards 1.76 area.
