SDS GROUP BERHAD
The stock is in a strong uptrend since mid-August 2024, as indicated by the series of higher highs and higher lows.
A noticeable increase in volume has occurred recently, supporting the upward price movement.
High volume in the last few sessions suggests strong buying interest, further validating the breakout above the previous resistance around MYR1.15.
Support: The previous resistance of MYR1.15 now acts as support. If price retraces, this level may provide some buying interest.
Resistance: The current price level of MYR1.23-MYR1.25 may act as near-term resistance, especially since the price has reached the upper Bollinger Band.
The recent candlesticks are relatively bullish, showing strong upward momentum.
Bullish momentum is strong, supported by increasing volume and the price trading above the moving average.
Caution may be warranted due to the price touching the upper Bollinger Band, which could lead to a short-term pullback or consolidation.
The MYR1.15 level is key support, while the MYR1.23-MYR1.25 zone could act as near-term resistance.
SDS trade ideas

SDS GROUP BERHAD - [SDS]Trend Analysis :
Short-Term Trend: The stock has been in an uptrend since early August, with a notable increase in both price and volume, indicating strong bullish momentum. The recent candles show higher highs and higher lows, typical of an uptrend.
Medium-Term Trend: The medium-term trend has been sideways from May to July, with prices consolidating between MYR0.85 and MYR1.05. The recent breakout above MYR1.05 signals a potential continuation of the uptrend.
Bollinger Bands :
The Bollinger Bands are expanding, which often indicates increased volatility. The price recently touched the upper band, which is generally seen as a sign of overbought conditions in the short term. However, the strong bullish candles suggest that the uptrend might continue, especially if the price stays above the middle band (20-day moving average).
Volume Analysis :
The volume spikes seen during the recent uptrend confirm the strength of the breakout. Increased volume on up days is a positive sign and suggests that the recent price move is supported by strong buying interest.
Support and Resistance Levels :
Immediate Support: Around MYR1.05, which was the previous resistance level before the breakout. If the price pulls back, this level could act as a support.
Immediate Resistance: Around MYR1.20, which is where the stock is currently trading. If the price continues to rise, this level could be tested as the next resistance.
Candlestick Patterns :
The recent candlestick pattern is a strong bullish candle, which suggests that buyers are in control. However, watching for any reversal patterns at the resistance level is essential.
Overall Sentiment :
The overall sentiment for SDS appears to be bullish in the short term, with strong price action, volume, and moving averages supporting the uptrend. However, traders should monitor the price action closely near resistance levels and be cautious of any signs of reversal or consolidation.

SDS PROBABLY MARKING UPAs plotted, This looks like Typical Re-Accmulation (Rising Bottom, Schematic #2)
What interesting to me, is that the incoming supply is reducing and evaporating as evidence by vol @ 29/7/24 (Black Arrow)
-As mentioned by David weiss : Probably this is The Contraction
Thus i humbly initiated my position as attahced
Pure Wyckoff, Anything can happen

SDS, Uptrend based on AlgoSignal StrategyThe current point exhibits promising upward signals according to my algorithmic system, meeting various criteria. These include rising trading volume, an upward trend indicated by prices above EMA20 and EMA50, and the closing price surpassing VWAP. As a result, the present conditions suggest a potential upward trend.

SDS, Uptrend based on AlgoSignal StrategyThe current point exhibits promising upward signals according to my algorithmic system, meeting various criteria. These include rising trading volume, an upward trend indicated by prices above EMA20 and EMA50, and the closing price surpassing VWAP. As a result, the present conditions suggest a potential upward trend.

SDSEP 0.595/0.6/0.605
TP 0.625
SL 0.585
Backtest result from 2022-07-29 09:30:00
63 trades
76% win rate
p.s: not a financial advice
#deepagiscreener #TAYOR #bursa

SDS - Chart Pattern AnalysisSDS break out Cup & Handle Pattern
Potential target price 1 @ 0.465
Potential target price 2 @ 0.540
Disclaimer:
This is intended to be used and must be used for technical analysis education purposes only. Trade at your own risk.

weekly idea WHAT and WHEN to entry hooksystemfind what to buy from Screener trigger
find when to enter
Hooksystem
Systemdgc
analytical technical learning only, not a recommendation to buy this stock

Bullish BiasThe share price rebounded upon touching resistance turns support at 0.35, followed by a bullish pennant pattern. We notice a breakout above the pennant today, suggesting further movement to the upside. The nearest Fibonacci resistance is seen at 0.465, followed by 0.58 and 0.655. Price movement below 0.34 would negate this expectation.
Disclaimer: No trading strategy provided here. Our content is intended to be used and must be used for technical analysis education purposes only

VCP SETUP SDSIncreasing YOY and QOQ for 2 consecutive quarter report.Price is trying to break the horizontal line.Look for breakout with high volume


SDS 10/5/202110th May 2021
Technical Stock Idea: SDS
SDS GROUP BERHAD (0212)
We see SDS was trading in an uptrend channel and now was testing it support area (0.40-0.435).
We think that if share price able to sustain above 0.445 that will show possibility break last high (0.485) and testing new high.
🎯 R1: RM 0.485
🎯 R2: RM 0.500
🎯 R3: RM 0.520
✂️ S1: RM 0.40
✂️ S2: RM 0.35

SDS - Bullishness IntactSDS
Theme: Retail
Rst: 0.445
Spp: 0.395
Well supported above 0.415, and indicators continue to sustain around bullish territory. The stock still can see a break through from Fibo Ext 100% at 0.445

#SDS DTF - Fibonacci Strategy trading plan with Golden wave The most of strongest Momentum wave - Golden Wave (impulse)
Criteria :
Minor wave 3 in 3rd impulse major Elliot Wave
Strong Bullish Momentum volume unusual
Steepness of a trend line increases from 45% to 70% deg
Strong Break in bar retracement symmetry leading to a change in trend behavior
Bullish gap up price action

SDS All time highMight be breaking out the 0.435 resistance level. need to see how it open next monday. it also might reverse back to 0.385 resistance level. we can see a guild higher high and higher low at the resistance before it close above it. my prediction is the price will continue to breakout next monday!
Stop loss 0.42

Understand RSI to trade market cycleAccumulation, Mark up, Distribution, MarkDown this is a normal basic market cycle due to human behavior.
RSI is considered a momentum indicator. Normally people use to trade for overbought and oversold.
But sometimes, the overbought and oversold condition can be continuos for a long period of time.

4 Malaysia Stocks To Watch During Sector Rotation Traders often have no idea what to do during market correction or sector rotation because their stocks are in a losing position. Also, they struggle to find stocks that are bucking the trend.
In this video, you will find out these 4 Malaysia stocks - MYX:CCK , MYX:DAYANG , MYX:OSK and MYX:SDS that outperform the market during the sector rotation and how to take advantage from these stocks by trading the pullback or trading the breakout.

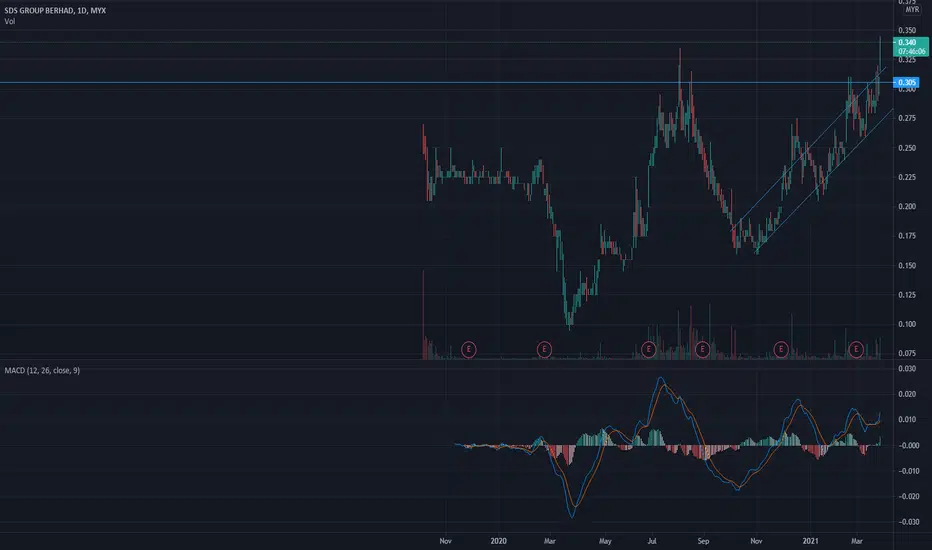
SDS Breakout 52 New High With VolumeDAILY 25/3/2021 :
Breakout : 52 Weeks New High
Market Stage : Uptrend
EMA : Price > Ema20 > Ema50 > Ema200
Breakout Volume : 7x times
Trading Breakout Value : Rm23 juta
Weekly 22/2/2021 :
Breakout : 52 Weeks New High
Market Stage : Uptrend
EMA : Price > Ema20 > Ema50 > Ema200
Breakout Volume : 3.7x times
Trading Breakout Value : Rm39 juta
SDS has been trading above its upward sloping 20-Day Moving Average which is a good sign. In addition, the price just broke the resistance of 0.31 reinforcing the bullishness in the recent price movement. This breakout was accompanied by a higher than average traded volume which shows the enthusiasm of the traders to push the price higher and past this resistance hence giving a higher probability of a successful breakout.

SDS breakout!after a build up under resistance 0.305, sds finally breaking the resistance and open the candle at 0.32 and hit the all time high! excited to see what will happen today!
Resistance Breakout with High VolumeResistance Breakout with High volume.
TP target based on Fibonacci Extension on previous High and Low prior to breakout.


SDS breaking previous high resistantChart pattern is forming a triangle earlier, and price just break up, and stop at previous high.
wait for a confirm breakout 0.275, then only buy in
Risk reward ratio = 2+
CL = -10%
Like my works? Please hit the Like, Follow and Share :)
Thanks!
Disclaimer
This information only serves as study references, does not constitute a buy or sell call.
