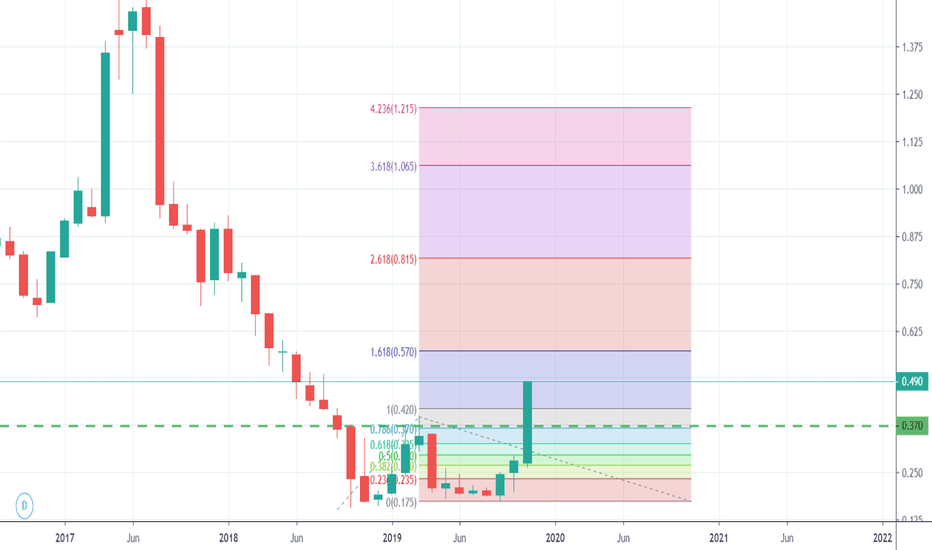
SEACERA GROUP BERHAD (7073)Stochastic and RSI oversold with MA20 crossover as buy confirmation, R/R 1:1
Invest 3600 unit @ price 0.240 - RM900
TP - 0.295
SL - 0.205
TP profit - rm162
SL value - rm162
Disclaimer - Trading Futures, Forex, CFDs and Stocks involves a risk of loss. Please consider carefully if such trading is appropriate for you. Past performance is not indicative of future results. Articles and content on this website are for entertainment purposes only and do not constitute investment recommendations or advice.
SEACERA trade ideas
SEACERA - Seeking New Direction Above MA200SEACERA - Just recently broke out from MA200 with widening Bollinger Band, MACD & RSI both still in their bullish trajectory. We anticipate the stock is now trying to complete its consolidation formation within the symmetrical triangle drawn in the chart, any chance to breakout shall unleash fresh bullish momentum towards 0.315, support observable at MA200/ 0.245. Please note: PN17 counter is highly risky to trade.
TradeVSA Stock Review - Media & FajarPullback with strength
Send us your preference stock to review based on TradeVSA chart by comment at below.
Disclaimer
This information only serves as reference information and does not constitute a buy or sell call. Conduct your own research and assessment before deciding to buy or sell any stock


