The lowest and the safest price to long SMCAP?If it follows the storyline, that's the sign to buy SMCAP. MN inverted Head and Shoulder pattern with tested every near support. If the price closes above MN strong support showed as the white line, then it is the 1st confirmation for reversal price. There is a breakout trendline of a downtrend and that's the 2nd confirmation for reversal price. Interception of MA and RSI indicator showing the 3rd buy confirmation. That's only left 1 more confirmation for clear buy which is to breakout the nearest Weekly Resistant colored as an orange line. This is purely technical analysis to buy the cheapest price which is reversal not continuous. Fundamental analysis is not included. Trade at your own risk. TAYOR
SMCAP trade ideas

SMCAP IN HARMONIC PATTERNSMCAP spotted in bullish flag formation and bearish bat harmonic pattern where a probable swing trade can be taken from the current price to Point D.

dark horse july 2021 go go go sMcap using buy on Break strategicuptrend
got three white soldier if today the price 0.385
set at buy at 0.385
TP 0.423
SL 0.345

SMCAP weekly chart looks interesting.Smcap weekly chart looks interesting.
1) WXY Corrective Pattern with wave Y terminated at 0.06 on 16 March 2021.
2) Since then, smcap has been moving upwards and has breakout from the corrective channel.
3) For now, I am assuming that the upward momentum is a zigzag pattern correcting the downtrend to form a wave X for WXYXZ pattern.


SMCAP AnalysisDisclaimer: This is not a buy call but for learning purpose
Technical Analysis
Price around MA40
Volume OK
Potential rebound at MA line
RSI slightly below 50
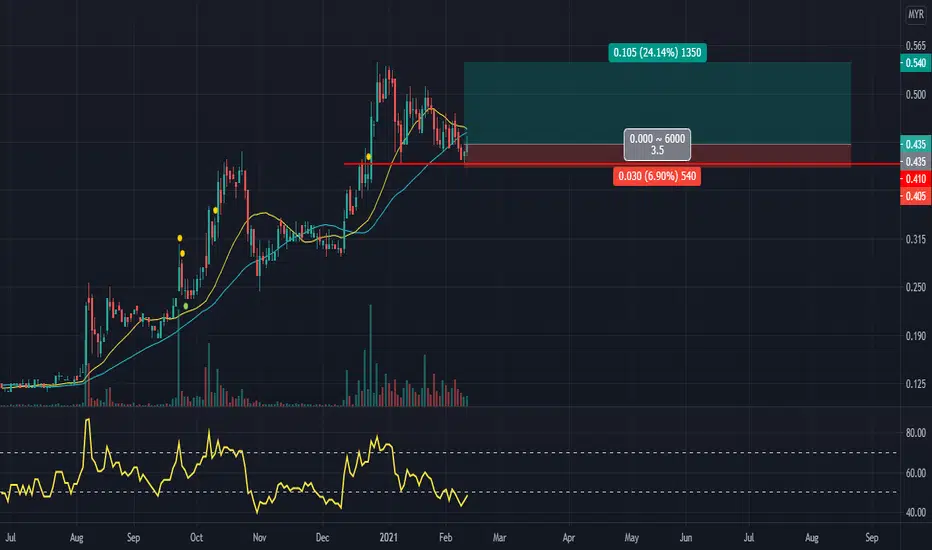
SMCAP rebound from supportExpecting a rebound from bottom of the uptrend tunnel.
Selling pressure getting low, and buying momentum increase.
Risk reward ratio = 2.7
TP = 20%+
CL = -8%
Like my works? Please hit the Like, Follow and Share :)
Thanks!
Disclaimer
This information only serves as study references, does not constitute a buy or sell call.

SMCAP ELLIOT Following on the zigzag pattern in 4H time frame, it's look the pattern is already complete. In daily time frame it shows the impulse wave of 4 is looking good on this area 0.410. The entry is for this stock is quite good on this area, unless it break 0.410, the correction will be change from ABC to WXY. It just a plotting elliot from a nubies.


SMCAP 21 DISEMBER – PONTESI TERUSKAN KENAIKANSektor: Consumer Products
Sub Sektor: Agricultural Products
Status Indeks: Buat HL dan meneruskan kenaikan (uptrend)
Status Fundamental: -
Market stage: 2
Trading Plan:
Target Price 1 (TP1) - 0.430
Target Price 2 (TP2) - 0.525
Strong Support (SS) - 0.380
Cutloss (CL) - 0.360
Cadangan 'entry':
1) Harga kemungkinan akan naik terus pecah R4 / ATH dan R4 akan dijadikan RBS.
2) Harga kemungkinan akan jatuh ke sekitar 0.375 atau jatuh sehingga 0.36 sebelum buat kenaikan semula.
Komen 1: SMCAP dalam keadaan uptrend dan sedang buat HL setelah breakout R3 dengan high volume. Mencuba untuk breakout R4 tapi tak berjaya.
Komen 2: Berjaya break dtl1 dengan high volume dan cubaan untuk break dtl2. Analisis moving average dapat dilihat MA20 baru mula nak cross atas MA50 (sign of uptrend) dan harga sudah naik jauh dari line ma.
Komen 3: MACD positive (biru atas merah). Bar hijau membesar. RSI & stoch bakal menuju ke overbought. Stoch mempunyai kekuatan tertinggi disokong dengan high volume. Volume tertinggi berbanding volume sebelumnya.
Boleh ride the trend untuk short/medium swing.
** Penafian: Hanya untuk pembelajaran dan tujuan kajian sahaja. Tiada 'buy call' diberikan.
** Selamat berdagang!


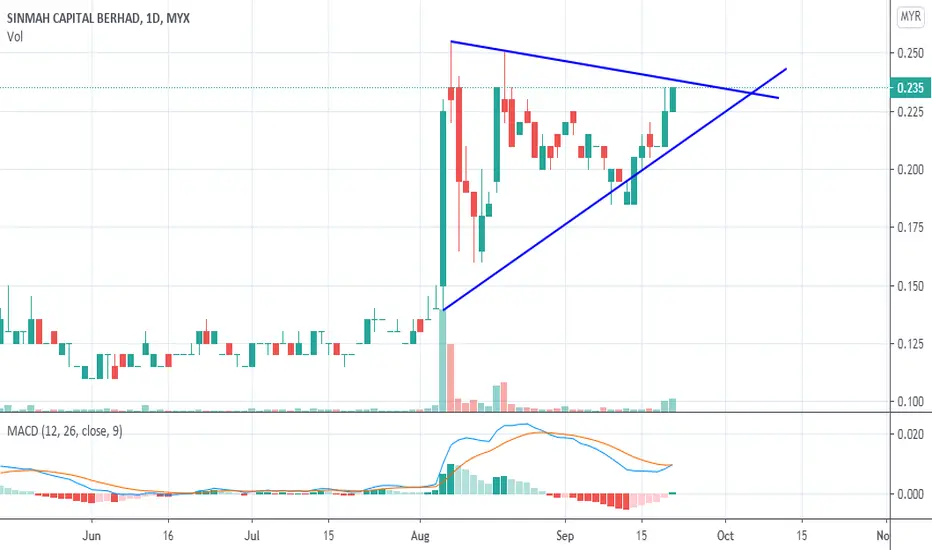
Breakout Resistance1. Consistantly uptrend with new breakout on resistance
2. Will try to re-test the nearest resistance


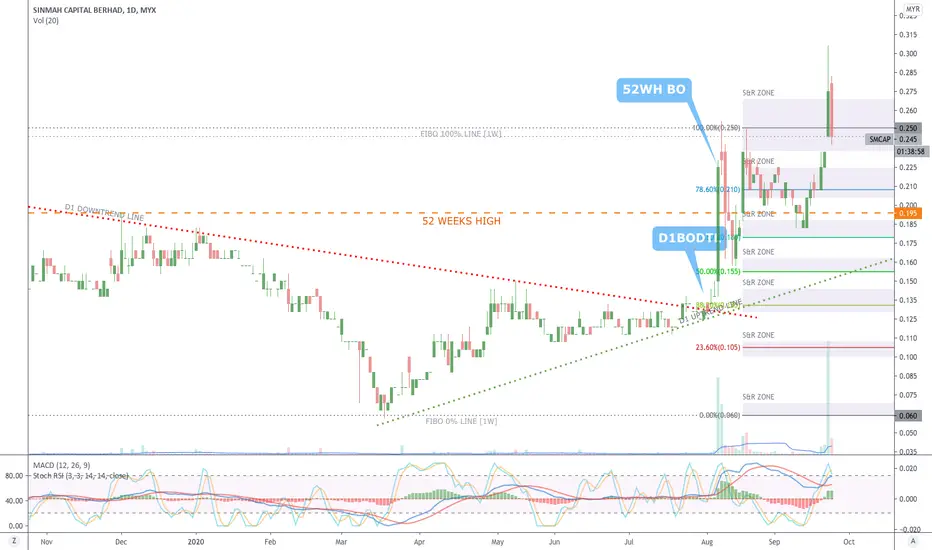
SMCAP [24 September 2020] Strategy: Buy On Dip in Support ZoneMYX:SMCAP
Breakout Downtrend Line
52 Weeks High Line
Fibbonaci Retracement
Candlestick Support & Resistant Zone
Trendline Support & Resistant

<TradeVSA> Re-accumulation in SinmahStrength in the chart:
1. Confirmation on accumulation
2. Re-accumulation after high volume upbars
3. Support near spring
Send us your preference stock to review based on TradeVSA chart by comment at below.
Disclaimer
This information only serves as reference information and does not constitute a buy or sell call. Conduct your own research and assessment before deciding to buy or sell any stock
