SOLUTION : Filter 3 has appeared at DTFFilter 3 combines the conditions of both Filter 1 and Filter 2. It requires that both Filter 1 and Filter 2 generate signals simultaneously. When this happens, it indicates a strong breakout signal with price and volume confirming the upward momentum.
TAYOR
SOLUTN trade ideas

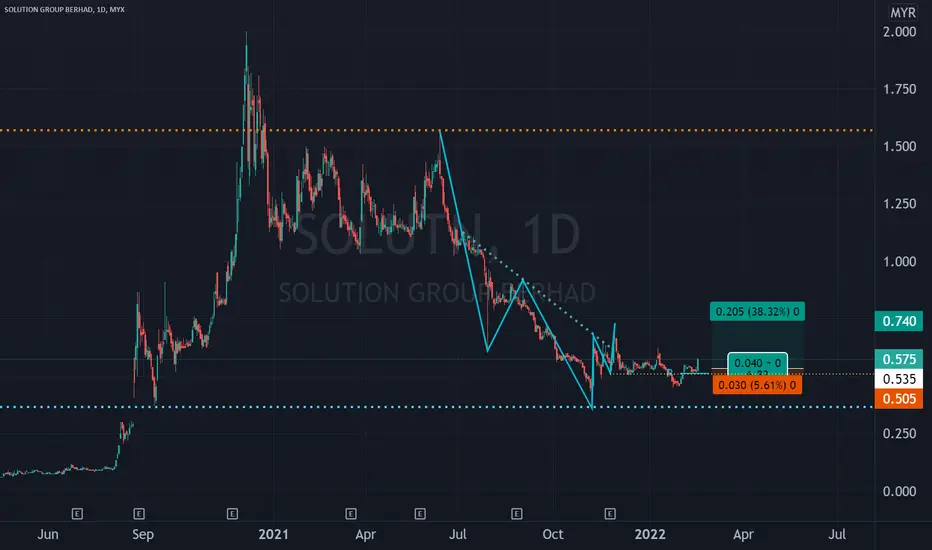
SOLUTN triggered based on MRV1 on closing 18 Dec 23Buy signal triggered based on MRV1 setup at RM0.240;
20% target at RM0.290; stop loss at RM0.215;
2-3 months due to the signal based on the daily timeframe.
**Only for discussion purposes. Not a buy / sell call**

Price has rebound!Price has rebound from demand zone and looking to break the upper trendline. Let’s monitor closely.

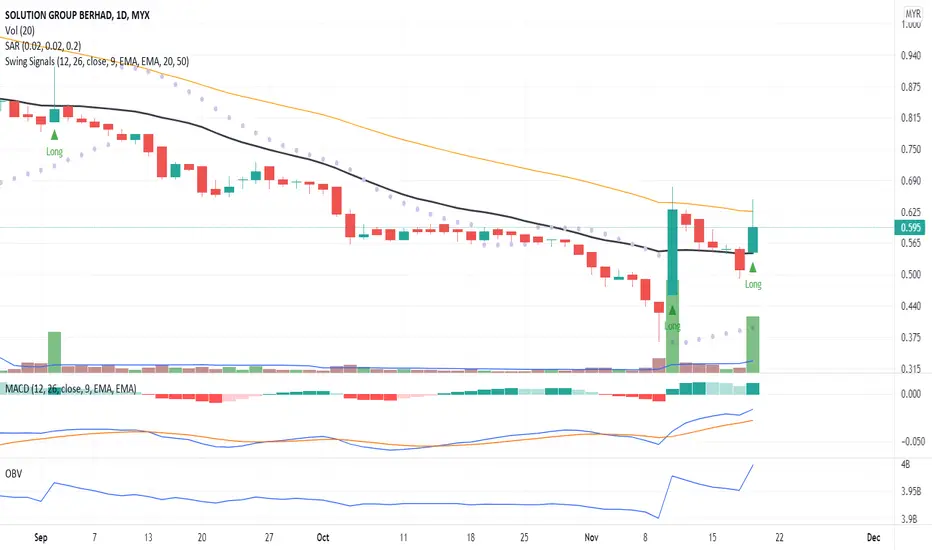
A Breakout Signal!The candlestick pattern indicates a price breakout signal right above the MA13 line due to significant price movement backed by high volume.
The MACD and RSI also show a positive reading which indicates a divergence signal.
Let's SOLUTN in WL and watch out for significant price movement toward the next price resistance.
R 0.380
S 0.270

SOLUTN IN INVERSTED HEAD AND SHOULDER PATTERNConsider to study, analyze and monitor SOLUTN in its daily chart which appears to have formed an inverted head and shoulders pattern. Proposed EP is at 4htf pivot point. Or EP at current price also but must exit if the price falls below the right shoulder.
CORAK SYMMETRICALCoretan Trading Idea ini hanyalah kajian & pembelajaran sesuatu kaunter saham SAHAJA. Ini BUKAN merupakan satu bentuk BUY CALL kepada mana - mana pihak dari penulis.
Mana - mana pelabur dan pedagang adalah bertanggungjawab terhadap tindakan dan pelaburan masing - masing.
BERDAGANG DI ATAS RISIKO ANDA SENDIRI

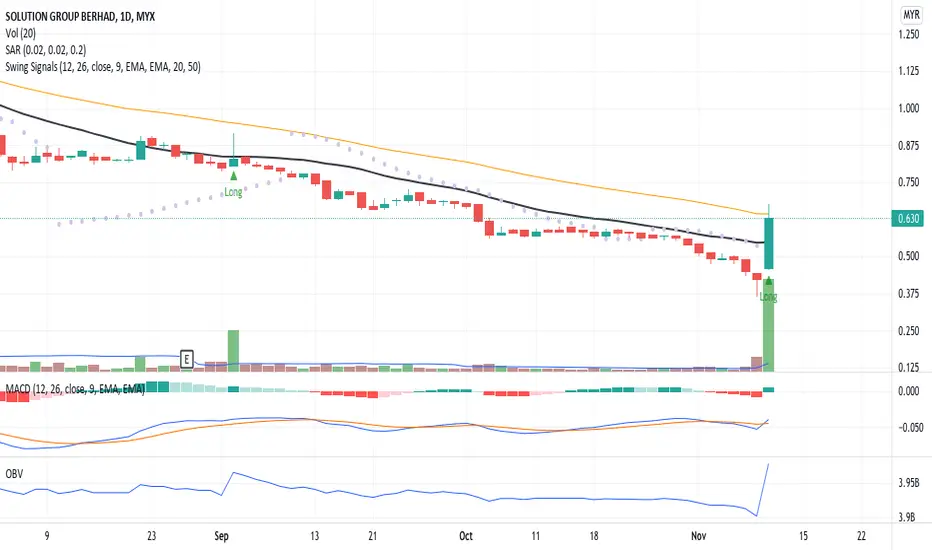
A Reversal Signal!The trend is in a reversal signal when the candlestick body closed above MA20 with high volume confirmed a buying interest by traders. From the Fibonacci Retracement chart, the trend line confirmed the price rebound from the support line.
MACD and OBV charts indicate an early stage of divergence signal. Therefore, precaution is required where the price probability may decline below MA20 with low volume.
Put SOLUTN in your WL and watch out for significant price movement with volume.
R 0.675
S 0.540
A Breakout Signal!Due to significant price movement, the candlestick and volume closed above MA20 with the price in a breakout signal.
MACD and OBV charts indicate a divergence signal. Hence, with a high probability of a long trade position.
Will the price continue the uptrend momentum or price correction 10% to 20% drop in value from a recent peak price on the next trade?
Put SOLUTN in your WL and watch out for price uptrend momentum.
R 0.720
S 0.550
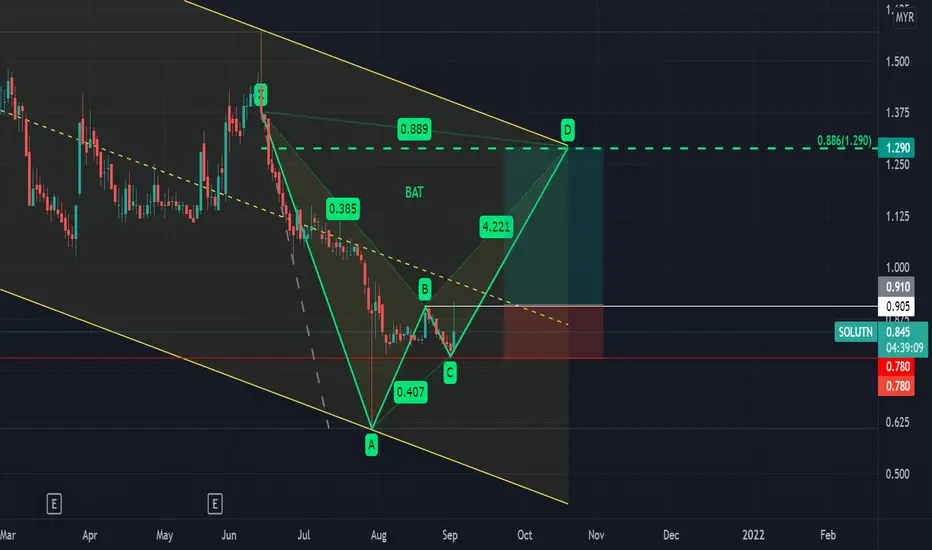
BAT SOLUTNWatch list if price BO above 0.90.
1. Bat pattern will be valid if the price passes and closed above point B. That the entry point (white line)
2. The price must always be above point C to determine this form still applies. Point C is cutloss price (red line)
3. My expectation the price will reach point D as TP1 to complete this Bat pattern at 0.886% (0.685).
#TAYOR MYX:SOLUTN
SOLUTION VCP SETUP2020 SOLUTION VCP Setup manage to get 100% profit! (see my previous sharing in below link)
Once again, SOLUTION is forming another VCP setup with low risk entry point (~7%)
C1: -46%
C2: -19%
C3: -12%
C4: -7%
Cansino vaccine green light from goverment coming soon?
Disclaimer:
The content provided is my personal experience sharing through technical and fundamental analysis point of view. The content can only be used for education purposes and NOT any recommendation for buying or selling stock. Please ask your remiser/dealer for making decision. Trade at Your Own Risk.

SOLUTN potential to go upsideDaily crossed Ichi cloud.
Week above Ichi cloud. To cross intersect blue.
30Min - Overbought, momentum max, wait for pullback to EP.
(Just for research & learning)


Breakout with VolumeSOLUTN breakout with volume . TP1 is expected at 1.35 and TP2 = 1.50. Follow your trading plan to entry.
Disclaimer: This is just an idea for educational purpose only. TAYOR.

SOLUTN 22022021solutn first half break above 1.40.
price need to stay and close above 1.38-1.40 .
next resistance 1.50.

WL 14 Feb - 19 Feb - Solution Group BerhadKey levels:
Support at 1.22
Resistance at 1.50
Monitor for price movement if can break the short term downtrend line.


Solution Group Cansino Announced that the vaccine has minimal side effects and the share price surge ( + 43.6 or 17.27% ) to close at historical high of HKD 296.00

SOLUTNWAVE4 -buying climax spotted at level FIBO 0.382, price broke 1.240 level with high volume valid, very high probabilities price will touch 1.445 with more buying interest to push to the upside , and possible rounding bottom (CUP) pattern will be form . my mind-term target will be 52WH as for now


SOLUTN - Falling Wedge Breakout, What's Next? / Trap Alert!SOLUTN
Rst: 1.48
Spp: 1.22
Solid green candle broke from falling wedge formation, indeed the breakout is initiated on Friday, so if you miss the ride strongly not encourage to chase. A breakout forged from narrow BB, will not be sustaining

