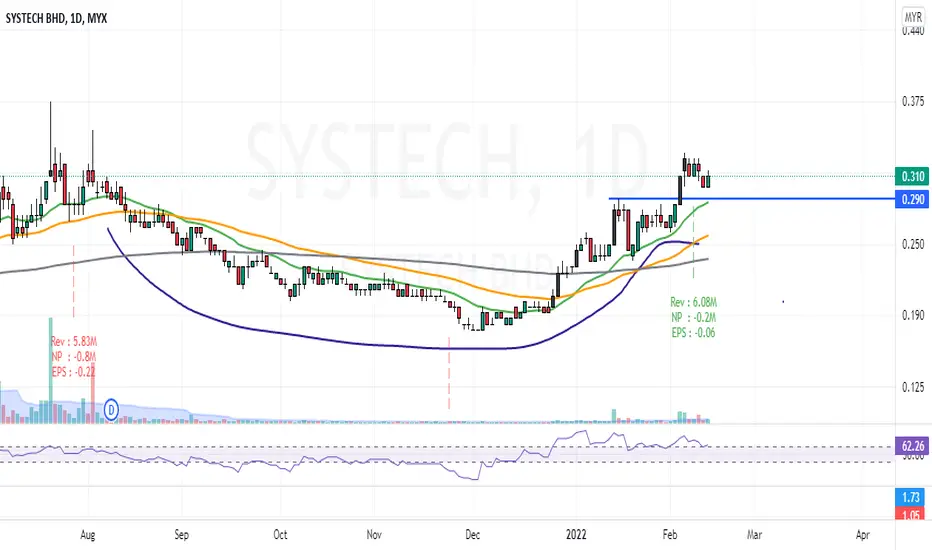
Systech, any reversal signal?
The chart displays a downward trend for SYSTECH. The stock price has been declining over the past few months, with a series of lower highs and lower lows.
* Resistance Levels: The stock has encountered resistance at the 0.400 and 0.350 levels, where it has struggled to break above. This indicates that there is significant selling pressure at these price points.
* Support Levels: The stock has found some support at the 0.250 level. However, it is important to note that this support level has been tested multiple times and may not hold in the future.
* Volume: The volume has been declining during the downtrend, which suggests that there is less interest from investors in the stock.
Potential Rebound or Continued Downward Trend:
Based on the current chart, it is difficult to predict a clear rebound. The stock may continue its downward trend if the current support levels break.
However, there are a few factors that could potentially lead to a rebound:
* News or Events: Positive news or events related to the company could trigger a buying interest and lead to a price increase.
* Technical Indicators: If technical indicators such as the Relative Strength Index (RSI) or Moving Averages start to show bullish signals, it could indicate a potential reversal.
* Market Sentiment: A change in market sentiment towards the stock could also lead to a rebound.
Important Considerations:
* It is important to note that technical analysis is just one tool and should not be used as the sole basis for investment decisions.
Disclaimer: Please be informed that all stock picks are solely for educational and discussion purposes; they are neither trading advice nor an invitation to trade. For trading advice, please consult your remisier or dealer representative.
SYSTECH trade ideas

SYSTECH (19/09/23)SYSTECH appears to be in accumulation stage between 0.42-0.44 for the past 21months. It has a good support at EMA50 and potential upward with TP 0.485 and 0.50.

SYSTECH, SETUP H4buy 5/10/23
capital rm 15884
tp 30% rm 4765.2 --> rm 20649.2
sl 11% rm1747.24 --> rm 14136.76
Fundamental : turnaround company

SYSTECH : Fill FVG gap and then....>> at OB area, RSI still OS, Watch out....
>> At FVG area, be careful of PB
>> Broken 510 and Hull MA, it may not look good.
>> Broken 490 consider GG.
>> Last support 470 area.
Risk reward worth?🤔🤔 Think about it.
When the market moves where, and how, and if - these are all unknown. The only thing which we can control is our risk. Focus on risk management!
Keep the long term vision.
Disclaimer: Mentioned stocks are solely based on own opinions for education and/or discussion purpose only. There's no buy and/or sell recommendation. Trading involve financial risk on your own. The author shall not be responsible for any losses or lost profits resulting from investment decisions based on the use of the information contained herein.

SYSTECHSYSTECH - TF Daily
Nice view until wave complete
Still under up trend trending
Cup and handle become available
Wait until wave complete and above resistance line
No need to fomo and comfirm first before you start ENTRY
#TAYOR
#MFM.TRADER

SYSTECH break down trend lineThe price just break the down trend line. Macd golden cross and histogram turn to green.
Entry 0.320
SL 0.285
TP 0.390
Risk to reward ratio 1:2

SYSTECH: PULLBACK ENTRY- Cup & Handle Formation
- Assume currently working on Triangle Formation
- Target estimation based on ABC Wave assumption (Conservative).
- Volume Profile acting as support
Disclaimer:
For discussion and sharing purpose only. NOT entry recommendation. Trade at your own risk.
#TAYOR

Bullish For SYSTECH?Based on weekly chart, it looks like Systech forming a triangle pattern. Moreover, the price closed above last week closing price with the indicator shows a signal rebounding from oversold region. In addition, the stock forming a bullish engulfing pattern on daily chart.

Systech ready for Long??Systech is currently in range trading mode, between 0.315 - 0.335.
next target should be 0.410 and beyond.

SYSTECH L-H-HL-HHSYSTECH
17/03/2023
Current Price = 0.305
Target Price 1 = 0.355
Target Price 2 = 0.405
Stop Loss = 0.270

CnH patternPrice breaks above the handle. Current retracing a bit at Fibo 50% and hit new 52week high. Possible uptrend if break and maintain above 50% fibo.


CUP AND HANDLE SYSTECHJust showing profits on latest quarter report on 10/2/2022.Price breaks above the handle.now retracing a bit
SYSTECH ON UPTREND1. Tenkansen above Kijunsen
2. Price above both Tenkansen and Kijunsen
3. Systech completed Fibo levels of 61.8% @ 0.30, now it may retrace back to the 100% mark of 0.375 achieved in June 2021
4. Buyers still in control.
5. Volume building up with forward Kumo bullish.
6. Chiko span heading away from price line

SYSTECH BEGINS UPTREND1. Price above Tenkansen and Kijunsen.
2. Tenkansen is above Kijunsen.
3. Both Tenkan and Kijun has left the Kumo cloud.
4. Chikou span is moving towards the top of Kumo and once it breaks free from Span B, it will confirm a bullish run.

SYSTECH IN HARMOMIC PATTERNSystech's current chart resembles that of a bearish bat harmonic pattern where a potential trade can be taken from the current price to Point B (0.300/0.305), which happens to be fibo382 (from swing high ie XA) or fibo618 (from swing low ie AB). 0.300/305 level is also yearly dynamic pivot. In addition, EMA200 has gone under the current price and so the other relevant EMAs. Critcal resistance is 0245 yearly pivot.


SYSTECH: 20-Days HighEP: 0.33 & 0.30
CL: Reach 10-Days Low
TP: 10%
Trying new method of buying at 20-Days High, and CL at 10-Days Low (kind of like Turtle trader).

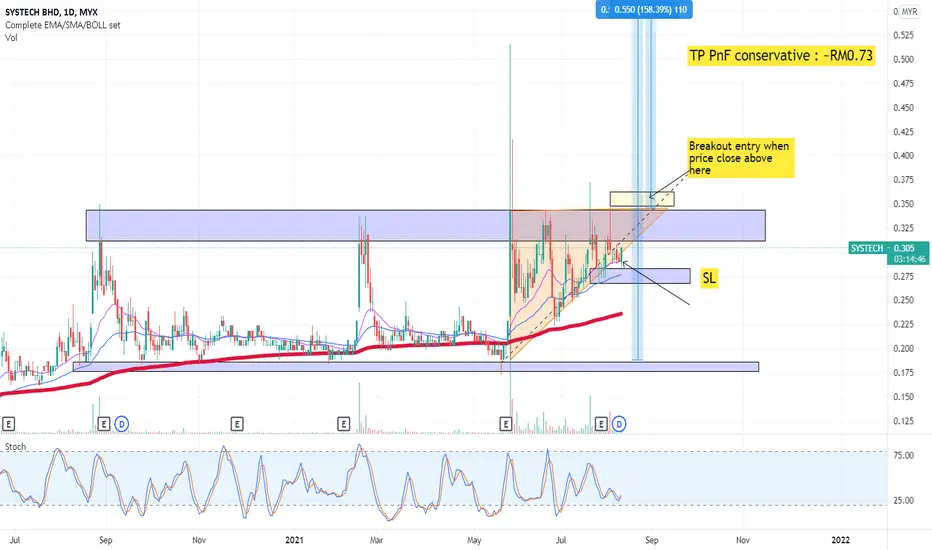
SYSTECH Rising Triangle Pattern1. Market consolidation phase.
2. Rising triangle pattern near the resistance area indicates buyers are willing to buy the share at a higher price.
3. There are 2 types of entry
a. Entry now with small SL
b. Entry after breakout the resistance above RM0.345
TP is subjective. Based on conservative PnF should be around RM0.73


SYSTECH VCP SETUPDisclaimer:
Analysis based on my experience and not a buy call recommendation. Trade at your own risk.

Trading Idea SYSTECH (19/7/2021) Trading Idea SYSTECH (19/7/2021)
- EMA crossover setup
- Support and resistance as drawn.
Disclaimer: This trading idea is strictly intended for educational purposes only so please do your own analysis before making any investment decision.
