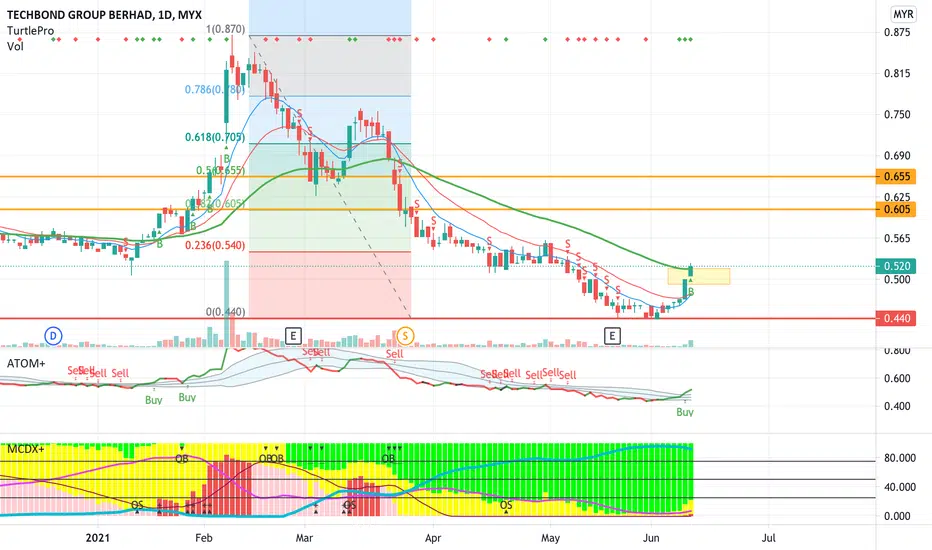
TECHBOND Potential uptrend 3 Reason for Holding this stock
TA show this stock is trading on bottom of parallel uptrend
I believe it trading undervalue now due to Business growth on past 2 years
Volume spike on previous week due to Kuok Brothers Sdn Bhd have exercise Techbond's Warrant. Holding percentage increased
Next report date
—
Report period
—
EPS estimate
—
Revenue estimate
—
0.030 MYR
16.39 M MYR
151.10 M MYR
227.22 M
About TECHBOND GROUP BERHAD
Sector
Industry
CEO
Seh Meng Lee
Website
Headquarters
Shah Alam
Founded
1996
ISIN
MYL5289OO003
FIGI
BBG00MJQ9RV0
Techbond Group Bhd. is an investment holding company, which engages in the provision of management services. It focuses on developing, manufacturing, and trading industrial adhesives, sealants, and providing supporting products and services. Its products include woodworking adhesives, paper and packaging adhesives, mattress adhesives, building and construction adhesives, hygiene and personal care adhesives, cigarette adhesives, automotive adhesives, bookbinding adhesives, and others. It operates through the Malaysia and Vietnam geographical segments. The company was founded in 1996 and is headquartered in Shah Alam, Malaysia.
Related stocks

Techbnd: Possible 0.6?Based on the current trend, confidence of buyer pphb group, this stock should go up and push further testing 0.60 soon.

TECHBOND, Uptrend based on AlgoSignal StrategyThe current point exhibits promising upward signals according to my algorithmic system, meeting various criteria. These include rising trading volume, an upward trend indicated by prices above EMA20 and EMA50, and the closing price surpassing VWAP. As a result, the present conditions suggest a poten

Techbond, Uptrend based on AlgoSignal StrategyThe current point exhibits promising upward signals according to my algorithmic system, meeting various criteria. These include rising trading volume, an upward trend indicated by prices above EMA20 and EMA50, and the closing price surpassing VWAP. As a result, the present conditions suggest a poten

Techbond broke resistant and pullback, good time to enter??Techbond Group Berhad, has recently Breaking Through Resistance Levels and Experiencing Pullbacks.
What is different this time around is that the volume is building up, which suggests that investors are becoming more interested in the stock. This can be seen as a positive sign, as a high volume of

TECHBND - Correction Is Done and Position for Bullish ReversalThe stock has likely done its complex correction wave WXYXZ, and like in the position of bullish reversal.

TECHBND - Looking goodSideway
Price maybe awaiting crossing MA 20
Harga dalam keadaan oversold
Berpeluang BDTL
Jom perhati harga nak kemana

Trading Idea TECHBND (14/6/2021) Trading Idea TECHBND (14/6/2021)
- EMA crossed-over with volume
- Support and resistance as drawn.
Disclaimer: This trading idea is strictly intended for educational purposes only so please do your own analysis before making any investment decision.
TECHBND (Technology) - 4H updateNote
- On previous close was a hit at 52 weeks high up. Limit up done remarkable increase in last 4-hour price/volume per day is a max of 14.M
- Suggest to take entry at either support level or at pivot level. Considering this stock merely for longer run trade.
- Expected will breakout top high in

TECHBHDnews regarding bonus issue already release. Base on technical analysis this counter has hit FIBO 200% and also at the same time 52week new
highers. FIBO 200% is max movement. so let we see together.

See all ideas
Summarizing what the indicators are suggesting.
Neutral
SellBuy
Strong sellStrong buy
Strong sellSellNeutralBuyStrong buy
Neutral
SellBuy
Strong sellStrong buy
Strong sellSellNeutralBuyStrong buy
Neutral
SellBuy
Strong sellStrong buy
Strong sellSellNeutralBuyStrong buy
An aggregate view of professional's ratings.
Neutral
SellBuy
Strong sellStrong buy
Strong sellSellNeutralBuyStrong buy
Neutral
SellBuy
Strong sellStrong buy
Strong sellSellNeutralBuyStrong buy
Neutral
SellBuy
Strong sellStrong buy
Strong sellSellNeutralBuyStrong buy
Displays a symbol's price movements over previous years to identify recurring trends.
Frequently Asked Questions
The current price of TECHBND is 0.315 MYR — it has increased by 1.61% in the past 24 hours. Watch TECHBOND GROUP BERHAD stock price performance more closely on the chart.
Depending on the exchange, the stock ticker may vary. For instance, on MYX exchange TECHBOND GROUP BERHAD stocks are traded under the ticker TECHBND.
TECHBND stock hasn't changed in a week, the month change is a −4.55% fall, over the last year TECHBOND GROUP BERHAD has showed a −30.00% decrease.
We've gathered analysts' opinions on TECHBOND GROUP BERHAD future price: according to them, TECHBND price has a max estimate of 0.44 MYR and a min estimate of 0.44 MYR. Watch TECHBND chart and read a more detailed TECHBOND GROUP BERHAD stock forecast: see what analysts think of TECHBOND GROUP BERHAD and suggest that you do with its stocks.
TECHBND reached its all-time high on Feb 9, 2021 with the price of 0.870 MYR, and its all-time low was 0.215 MYR and was reached on Mar 20, 2020. View more price dynamics on TECHBND chart.
See other stocks reaching their highest and lowest prices.
See other stocks reaching their highest and lowest prices.
TECHBND stock is 3.23% volatile and has beta coefficient of 1.22. Track TECHBOND GROUP BERHAD stock price on the chart and check out the list of the most volatile stocks — is TECHBOND GROUP BERHAD there?
Yes, you can track TECHBOND GROUP BERHAD financials in yearly and quarterly reports right on TradingView.
TECHBOND GROUP BERHAD is going to release the next earnings report on Aug 20, 2025. Keep track of upcoming events with our Earnings Calendar.
TECHBND net income for the last quarter is 4.42 M MYR, while the quarter before that showed 6.36 M MYR of net income which accounts for −30.59% change. Track more TECHBOND GROUP BERHAD financial stats to get the full picture.
TECHBOND GROUP BERHAD dividend yield was 2.75% in 2024, and payout ratio reached 49.02%. The year before the numbers were 2.00% and 36.06% correspondingly. See high-dividend stocks and find more opportunities for your portfolio.
As of Aug 10, 2025, the company has 242 employees. See our rating of the largest employees — is TECHBOND GROUP BERHAD on this list?
EBITDA measures a company's operating performance, its growth signifies an improvement in the efficiency of a company. TECHBOND GROUP BERHAD EBITDA is 28.87 M MYR, and current EBITDA margin is 18.63%. See more stats in TECHBOND GROUP BERHAD financial statements.
Like other stocks, TECHBND shares are traded on stock exchanges, e.g. Nasdaq, Nyse, Euronext, and the easiest way to buy them is through an online stock broker. To do this, you need to open an account and follow a broker's procedures, then start trading. You can trade TECHBOND GROUP BERHAD stock right from TradingView charts — choose your broker and connect to your account.
Investing in stocks requires a comprehensive research: you should carefully study all the available data, e.g. company's financials, related news, and its technical analysis. So TECHBOND GROUP BERHAD technincal analysis shows the buy rating today, and its 1 week rating is sell. Since market conditions are prone to changes, it's worth looking a bit further into the future — according to the 1 month rating TECHBOND GROUP BERHAD stock shows the sell signal. See more of TECHBOND GROUP BERHAD technicals for a more comprehensive analysis.
If you're still not sure, try looking for inspiration in our curated watchlists.
If you're still not sure, try looking for inspiration in our curated watchlists.