TTVHB
Breakout, pullback, entry? Why wait for pullback? Market moves by Fear & Greed of the participants (Day trader, Contra player, position trader, etc). Thats why we should always look for retracement around the key level after major moves to be safe. Don't chase, if she's the one she will come to find you!!! eh. TAYOR
This message is for education and information purposes only. It shall not be construed as an offer/solicitation or recommendation to buy/sell any stocks.
TTVHB trade ideas

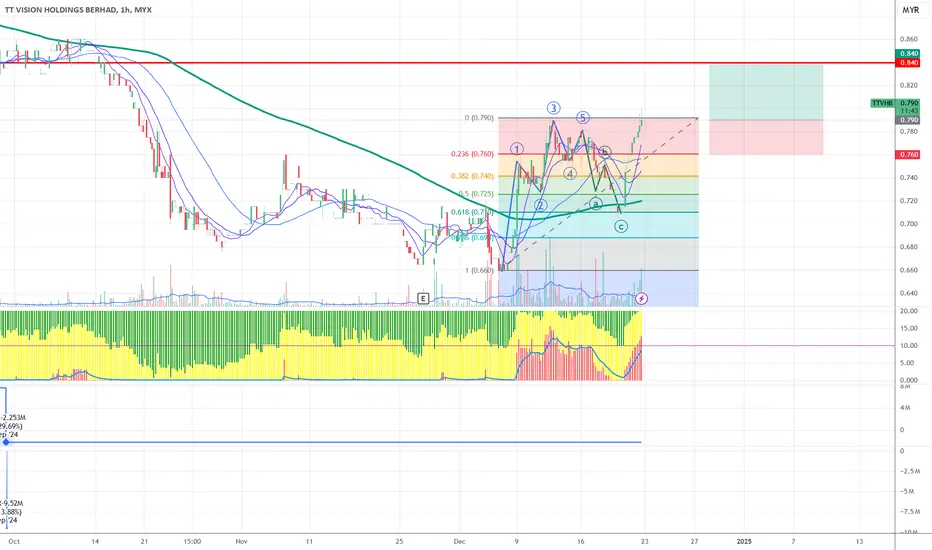
TTVHB making 3rd wavei put stoploss below the horizontal level of peak 1st wave, as i feel this is impulse wave
wave 3 will go up, and even if it retrace as wave 4, it will not move below peak of wave 1
A Positive Divergent Signal!The candlestick pattern indicates a positive divergence since the stock is in the accumulation stage before proceeding to an uptrend movement. The upper limit triangle-like shape indicates price resistance when prices move up the result of the price action should increase in volume.
The MACD and RSI indicators confirm the candlestick pattern which indicates a divergence signal.
Let's save TTVHB in WL and watch out for significant price movement with an increase in volume above the MA20 line.
R 0.840
S 0.695

KLSE : TTVHB (0272)HM signal (High momentum) spotted. Looking good with increasing volume and momentum.
Manage to break out the previous high with higher volume and support at good level @ 0.780 - 0.800. It is likely to trend higher if the momentum continue to rise from here.

TTVHB Simple Chart AnalysisTTVHB - Rst 1.37 & 1.7 Supp 1.21
Lookout if can breakout to go 1.7 or prepare to collect at support during retracement. Either way
How to view the guidance via chart ( Refer back to pin message guidance if to trade )
Red Line = Support
Blue Line = Resistance
Light Blue = bullish/bearish pattern
Arrow = Double/Trip top/bottom
Red Chip = $$
Green Chip = XX
