<TradeVSA> Change of Trend in TuneproSignal in the chart:
Weekly Chart
1. Change of trend with High Volume
2. Price holding well above 20/40ma with 2 Green Pentagon
Wait for Green Pentagon in Daily chart for momentum trade
Disclaimer
This information only serves as reference information and does not constitute a buy or sell call. Co
Next report date
—
Report period
—
EPS estimate
—
Revenue estimate
—
0.015 MYR
572.00 K MYR
430.20 M MYR
394.34 M
About TUNE PROTECT GROUP BERHAD
Sector
Industry
CEO
Kim Lian How
Website
Headquarters
Kuala Lumpur
Founded
2011
ISIN
MYL5230OO007
FIGI
BBG0042CW239
Tune Protect Group Bhd. is an investment holding company, which engages in the provision of management services. It operates through the following segments: Investment Holding and Others, Collective Investment Schemes, General Reinsurance Business, General Insurance Business, and Life Insurance Business. The company was founded on June 14, 2011 and is headquartered in Kuala Lumpur, Malaysia.
Related stocks

<TradeVSA> Pullback + Reversal in KLSESign of Strength in the chart:
1. Pullback Setup
2. Reversal Pattern
3. Effort bars in accumulation / reaccumulation
Stocks to monitor:
1. Resintec
2. Unisem
3. ATAIMS
4. Tunepro
Disclaimer
This information only serves as reference information and does not constitute a buy or sell call. Conduct y


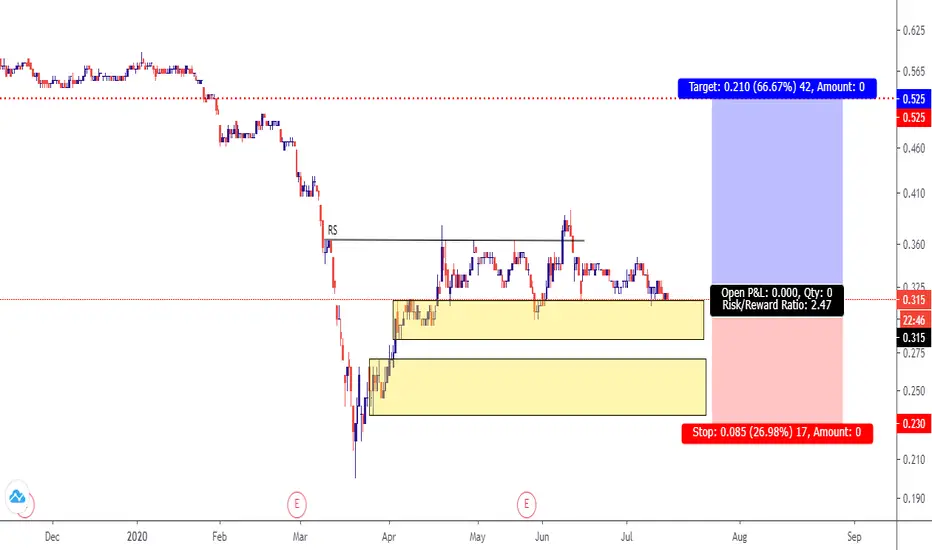
TUREPRO Target LONGTA
Simple view for this counter, if price able to maintain above 1st based then it will continue climbing up hopefully until target TP else it will goes to demand below it. Wait for reversal candle or bullish structure form at ltf before enter market.
FA
P/E : 6.8 (below 15 can consider undervalue)
<TradeVSA> Seller Zone at MRCB and TuneProStrength in the chart:
a. MRCB
1. Break and closing the gap down
2. Strength at the background
b. Tune Proctect
1. Testing the resistance (seller zone)
2. Accumulation and staying above 20 & 40MA
Send us your preference stock to review based on TradeVSA chart by comment at below.
Disclaimer
Th

See all ideas
Summarizing what the indicators are suggesting.
Neutral
SellBuy
Strong sellStrong buy
Strong sellSellNeutralBuyStrong buy
Neutral
SellBuy
Strong sellStrong buy
Strong sellSellNeutralBuyStrong buy
Neutral
SellBuy
Strong sellStrong buy
Strong sellSellNeutralBuyStrong buy
An aggregate view of professional's ratings.
Neutral
SellBuy
Strong sellStrong buy
Strong sellSellNeutralBuyStrong buy
Neutral
SellBuy
Strong sellStrong buy
Strong sellSellNeutralBuyStrong buy
Neutral
SellBuy
Strong sellStrong buy
Strong sellSellNeutralBuyStrong buy
Displays a symbol's price movements over previous years to identify recurring trends.
Frequently Asked Questions
The current price of TUNEPRO is 0.280 MYR — it hasn't changed in the past 24 hours. Watch TUNE PROTECT GROUP BERHAD stock price performance more closely on the chart.
Depending on the exchange, the stock ticker may vary. For instance, on MYX exchange TUNE PROTECT GROUP BERHAD stocks are traded under the ticker TUNEPRO.
TUNEPRO stock hasn't changed in a week, the last month showed zero change in price, over the last year TUNE PROTECT GROUP BERHAD has showed a −28.21% decrease.
We've gathered analysts' opinions on TUNE PROTECT GROUP BERHAD future price: according to them, TUNEPRO price has a max estimate of 0.48 MYR and a min estimate of 0.48 MYR. Watch TUNEPRO chart and read a more detailed TUNE PROTECT GROUP BERHAD stock forecast: see what analysts think of TUNE PROTECT GROUP BERHAD and suggest that you do with its stocks.
TUNEPRO reached its all-time high on Jun 2, 2014 with the price of 2.570 MYR, and its all-time low was 0.200 MYR and was reached on Mar 19, 2020. View more price dynamics on TUNEPRO chart.
See other stocks reaching their highest and lowest prices.
See other stocks reaching their highest and lowest prices.
TUNEPRO stock is 3.70% volatile and has beta coefficient of 0.25. Track TUNE PROTECT GROUP BERHAD stock price on the chart and check out the list of the most volatile stocks — is TUNE PROTECT GROUP BERHAD there?
Today TUNE PROTECT GROUP BERHAD has the market capitalization of 211.02 M, it has decreased by −3.51% over the last week.
Yes, you can track TUNE PROTECT GROUP BERHAD financials in yearly and quarterly reports right on TradingView.
TUNE PROTECT GROUP BERHAD is going to release the next earnings report on Aug 21, 2025. Keep track of upcoming events with our Earnings Calendar.
TUNEPRO net income for the last quarter is 5.90 M MYR, while the quarter before that showed 8.01 M MYR of net income which accounts for −26.32% change. Track more TUNE PROTECT GROUP BERHAD financial stats to get the full picture.
As of Aug 2, 2025, the company has 448 employees. See our rating of the largest employees — is TUNE PROTECT GROUP BERHAD on this list?
Like other stocks, TUNEPRO shares are traded on stock exchanges, e.g. Nasdaq, Nyse, Euronext, and the easiest way to buy them is through an online stock broker. To do this, you need to open an account and follow a broker's procedures, then start trading. You can trade TUNE PROTECT GROUP BERHAD stock right from TradingView charts — choose your broker and connect to your account.
Investing in stocks requires a comprehensive research: you should carefully study all the available data, e.g. company's financials, related news, and its technical analysis. So TUNE PROTECT GROUP BERHAD technincal analysis shows the sell today, and its 1 week rating is sell. Since market conditions are prone to changes, it's worth looking a bit further into the future — according to the 1 month rating TUNE PROTECT GROUP BERHAD stock shows the sell signal. See more of TUNE PROTECT GROUP BERHAD technicals for a more comprehensive analysis.
If you're still not sure, try looking for inspiration in our curated watchlists.
If you're still not sure, try looking for inspiration in our curated watchlists.