MY: Turiya Analysis 14.2.24Has break resistance 0.275. Low Risk can Look for retracement to enter. High Risk to enter now but if price already move, suggest not to chase this counter.
P/s: This is not a Buy / Sell call. Please due diligence before enter any trade. Trading can inccur partial / full loss. Outmost cautious need
0.040 MYR
9.55 M MYR
27.18 M MYR
72.38 M
About TURIYA BHD
Sector
Industry
Website
Headquarters
Kuala Lumpur
Founded
1961
ISIN
MYL4359OO005
FIGI
BBG000BDZ964
Turiya Bhd. is an investment holding company, which engages in the business of property letting and provision of management consultancy services. It operates through the following segments: Investment Holding, Investment Property, and Semi-conductor. The Investment Holding segment includes the provision of management consultancy services. The Investment Property segment handles the rental of office units. The Semi-conductor segment refers to the manufacturing of industrial machinery and chemical trading. The company was founded in 1961 and is headquartered in Kuala Lumpur, Malaysia.
Related stocks

KLSE : TURIYA (4359)HM signal (High momentum) spotted. Looking good with increasing volume and momentum.
Manage to break out the previous high with higher volume and support at good level @ 0.200 - 0.210. It is likely to trend higher if the momentum continue to rise from here.

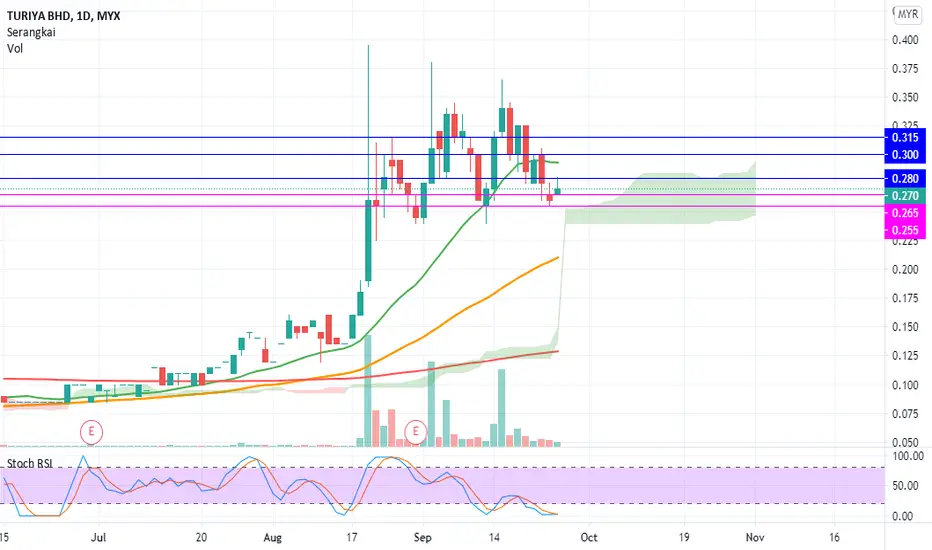
SWING TURIYA FOR MA200 AS SUPPORTas stated in chart.
In daily TF MA 200 as strong support.
Cl if BO below that.
#TAYOR MYX:TURIYA
<TradeVSA> TURIYA Completed ShakeoutSign of Strength in the chart:
1. Reversal with High Volume
2. NS in the background
3. Shakeout Completed
Disclaimer
This information only serves as reference information and does not constitute a buy or sell call. Conduct your own research and assessment before deciding to buy or sell any stock

TURIYAnice que, let see if opening become more interesting or not. good trend seems like there is pushing recently but lower pressure.

TURIYA - 4H updateNote.
- Doji candle detect in last minute closing date
- Expected there will be a correction - sideways trend in next swing
- Suggest EP 10% of buy, Recovery 80% of total buy.
- Exit when SL -2-4%


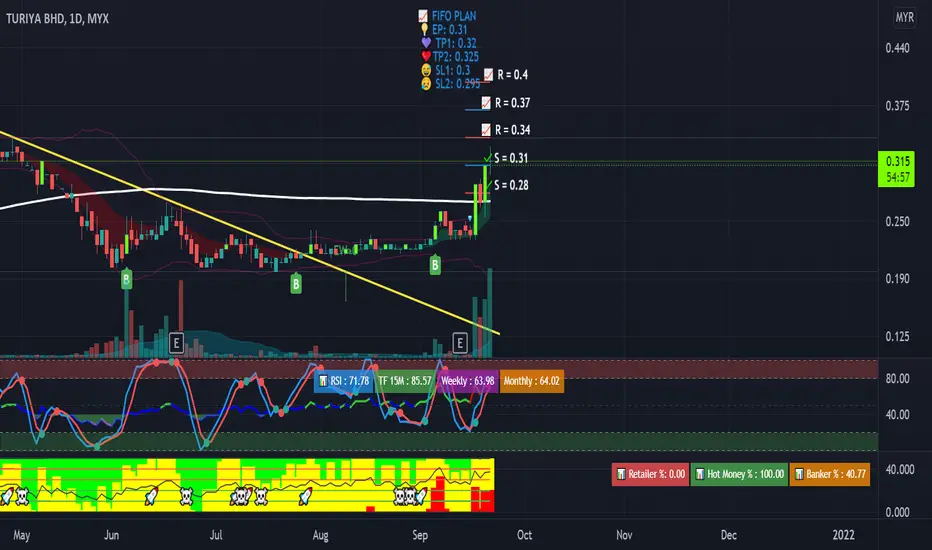
in making decisionCurrently the price in triangle pattern and the price still holding above EMA100, still in uptrend.
Need to wait momentum to push price higher and break resistant
TP: 0.315

See all ideas
Summarizing what the indicators are suggesting.
Oscillators
Neutral
SellBuy
Strong sellStrong buy
Strong sellSellNeutralBuyStrong buy
Oscillators
Neutral
SellBuy
Strong sellStrong buy
Strong sellSellNeutralBuyStrong buy
Summary
Neutral
SellBuy
Strong sellStrong buy
Strong sellSellNeutralBuyStrong buy
Summary
Neutral
SellBuy
Strong sellStrong buy
Strong sellSellNeutralBuyStrong buy
Summary
Neutral
SellBuy
Strong sellStrong buy
Strong sellSellNeutralBuyStrong buy
Moving Averages
Neutral
SellBuy
Strong sellStrong buy
Strong sellSellNeutralBuyStrong buy
Moving Averages
Neutral
SellBuy
Strong sellStrong buy
Strong sellSellNeutralBuyStrong buy
Displays a symbol's price movements over previous years to identify recurring trends.
Frequently Asked Questions
The current price of TURIYA is 0.280 MYR — it hasn't changed in the past 24 hours. Watch TURIYA BHD stock price performance more closely on the chart.
Depending on the exchange, the stock ticker may vary. For instance, on MYX exchange TURIYA BHD stocks are traded under the ticker TURIYA.
TURIYA stock has risen by 1.85% compared to the previous week, the last month showed zero change in price, over the last year TURIYA BHD has showed a −31.71% decrease.
TURIYA reached its all-time high on Jul 2, 2003 with the price of 1.820 MYR, and its all-time low was 0.060 MYR and was reached on Mar 25, 2020. View more price dynamics on TURIYA chart.
See other stocks reaching their highest and lowest prices.
See other stocks reaching their highest and lowest prices.
TURIYA stock is 1.82% volatile and has beta coefficient of 1.03. Track TURIYA BHD stock price on the chart and check out the list of the most volatile stocks — is TURIYA BHD there?
Yes, you can track TURIYA BHD financials in yearly and quarterly reports right on TradingView.
TURIYA net income for the last quarter is 6.36 M MYR, while the quarter before that showed 1.21 M MYR of net income which accounts for 424.83% change. Track more TURIYA BHD financial stats to get the full picture.
No, TURIYA doesn't pay any dividends to its shareholders. But don't worry, we've prepared a list of high-dividend stocks for you.
EBITDA measures a company's operating performance, its growth signifies an improvement in the efficiency of a company. TURIYA BHD EBITDA is 7.46 M MYR, and current EBITDA margin is 27.24%. See more stats in TURIYA BHD financial statements.
Like other stocks, TURIYA shares are traded on stock exchanges, e.g. Nasdaq, Nyse, Euronext, and the easiest way to buy them is through an online stock broker. To do this, you need to open an account and follow a broker's procedures, then start trading. You can trade TURIYA BHD stock right from TradingView charts — choose your broker and connect to your account.
Investing in stocks requires a comprehensive research: you should carefully study all the available data, e.g. company's financials, related news, and its technical analysis. So TURIYA BHD technincal analysis shows the strong buy rating today, and its 1 week rating is buy. Since market conditions are prone to changes, it's worth looking a bit further into the future — according to the 1 month rating TURIYA BHD stock shows the buy signal. See more of TURIYA BHD technicals for a more comprehensive analysis.
If you're still not sure, try looking for inspiration in our curated watchlists.
If you're still not sure, try looking for inspiration in our curated watchlists.