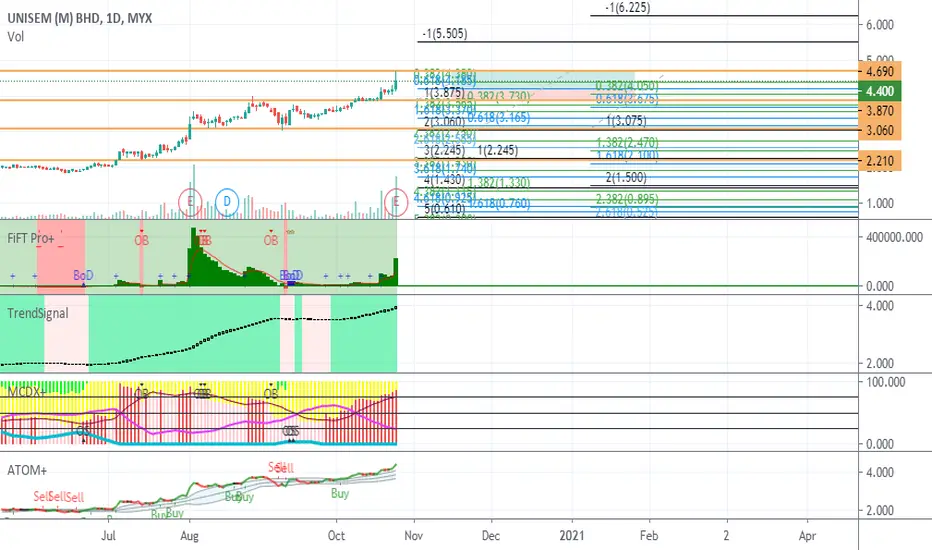
UNISEM - Bullish ContinuationUNISEM
Rst: 6.18/ 6.55
Spp: 5.55
Technical rebound casted from 261.8% & middle BB, this round is potentially the last of the last surge before trend reversal takes charge as the previous peak of RSI will not be easy be hit, means this will form serious bearish divergence when the stock moves higher.
UNISEM trade ideas

UNISEM [28 October 2020] Buy On Dip in Support ZoneMYX:UNISEM
SWING: 2 DAYS TO 2 WEEKS
Breakout Downtrend Line
52 Weeks High Line
Fibbonaci Retracement
Candlestick Support & Resistant Zone
Trendline Support & Resistant
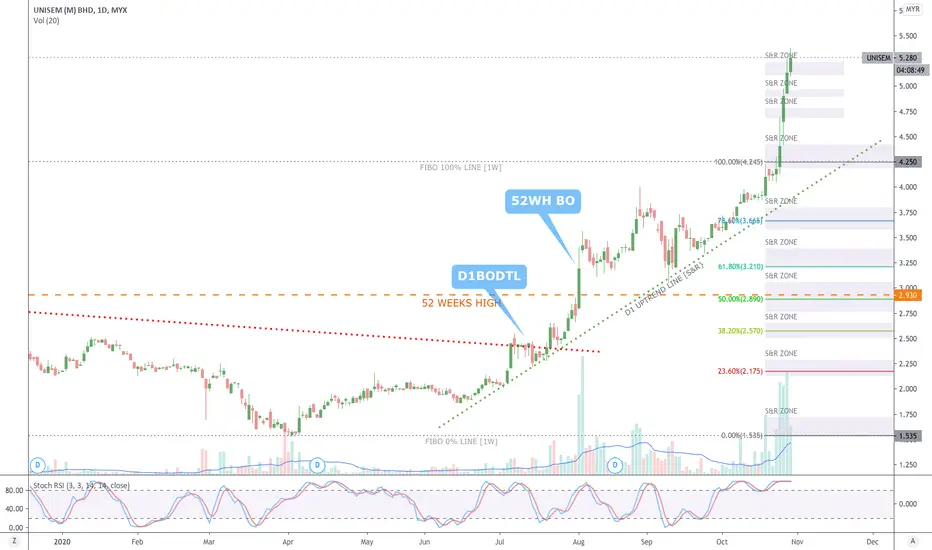
will it drop to 3.86 Question you need to ask yourself :-
1) Is it UPTREND ? ema 20 > ema 50
2) Is it BULLISH ? price > ema 50
3) Is it STRONG BULL ? fift positive
If yes,
4) Where is your Support and Stop Loss ? 3.86
5) Where is your Entry Point ? wait til 4.2
6) What is the % risk (Stop Loss - Entry Point)/Entry Point 8%
7) Can you take this N% risk ? yes
8) you got a setup if yes.
9) TP1 5.2
UNISEMMYX:UNISEM
TECH SECTOR: OSAT
WAITING FOR DESCENDING TRIANGLE BREAKOUT +FAST TURTLE BUY
FIFT +VE
ATOM: NEUTRAL
EP:FAST TURTLE BUY
SL: BELOW RM3
TP: RM4, RM5(LONG TERM)
COMPARE PEER TO PEER STILL UNDERVALUED PE AROUND 20
COMPARE INARI PE 47, GTRONIC PE 36


Unisem, you are still very strongIf you like my chart, just give me a LIKE, follow me and share it to your friend. :)
Disclaimer: I am not Investment guru. Every stock analysis are purely for my personal learning and practice purpose.
It is not for any buy or sell call to anyone. Everyone are responsible at your own trades.

Unisem, rising whatever head...Rising dragon head? or snake head? or earthworm head, or....Whatever...
TP 2.075, 2.100 and 2.270.


High Volume Shakeout Signal in Unisem (5005.KL)Shakeout tell you that there's demand for shares. It is a good thing to see on charts, and at times, they can be buying opportunities. Shakeout pushes the supply of readily available shares from the hands of the weak into the hands of the strong. Then the stock immediately turns and rushes higher, often within just few bars.
Based on Unisem daily chart, TradeVSA have spotted lots of shakeout bars during the accumulation and re-accumulation stage. The shakeouts are illustrated by the Spring (SP) signals. Notice the Spring bars dropped below the support with high volume to flush out weak-hand holders before Smart Money mark the price higher.
Using Volume Spread Analysis method, we notice that Smart Money tried to shakeout the weak-hand holders again on 7 December 2018. Currently it offered a very low risk trading opportunity as the price is close with support level and hidden potential buying area.
Stop Loss = RM3.14
1st Target = RM3.30
2nd Target = RM3.41
Send us your preference stock to review based on TradeVSA chart by comment at below.
Disclaimer
This information only serves as reference information and does not constitute a buy or sell call. Conduct your own research and assessment before deciding to buy or sell any stock.

Re-accumulation in the rising market – Unisem (5005.KL)Unisem formed a nice uptrend with price makes higher highs and higher lows. The price broke above the resistance level at RM3.17 with widespread bar and high volume. After the breakout, price immediately move sideways with narrow spread bars. The narrow bars with low volume shown Smart Money is test the supply in the market and formed a support level.
Currently the chart has formed 5 narrow bars which we called “Cluster of Closes” in the re-accumulation level. The strength of the background indicate Smart Money still interested to support and push the price higher. Below are the few strength signals in this chart:
1. Market structure in stage 2 (markup), no sign of distribution so far
2. 2 successful spring bars in the previous re-accumulation level shown Smart Money already flush out weak-hand holders
3. Successful breakout with 18LC signals with high volume
4. Formed another re-accumulation level to re-test the supply in the market
The “Cluster of Closes” formation give traders a good edge to trade now with lower risk.
Disclaimer
This information only serves as reference information and does not constitute a buy or sell call. Conduct your own research and assessment before deciding to buy or sell any stock.

UNISEM – Lookout for bearish reversal. Greetings to all.
Here are my technical reviews on UNISEM.
1. Chart pattern reveals the a pattern of what seems to be a head & shoulder pattern.
2. Current crucial support stands at 2.79.
3. RSI unable to break 50% level indicates weakness in strength of buyers.
4. MACD sliding downwards indicating weakness in trend + candlesticks are turning yellow (yellow candlesticks indicates weakness in trend).
5. Watch 2.79 as crucial support, if broken, the price might head to 2.60 level.
This sharing has been designed for informational and educational purposes only and does not constitute opinion of whether to buy or sell any security which may be referenced upon this sharing. The services and information provided through this site are for personal, non-commercial, educational use and display. There are substantial risks in stock trading and therefore all investors are advised to conduct their own independent research or seek professional investment advice into individual stocks before making a purchase decision. Cheers

UNISEMWaiting for a slight retracement to come back. Head and shoulder seems convincing. Good for a mid term hold.
PS : Pure Technical
