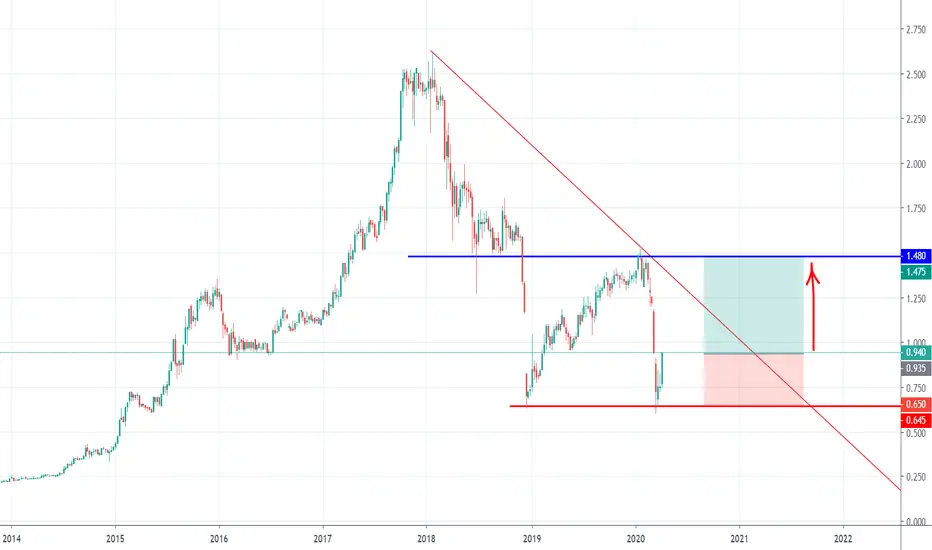
V.S can it continues its uptrend to its previous ATH amid -ve QRFA:
- EMS player
- manufacturer
Financial :
QoQ -ve
YoY -ve
future prospect: recovery on 2H20 & back to profitable on FY21
Price : EPS 5.86
1.8 PE 30.71
2.0 PE 34.13
2.62 PE 44.70
VS trade ideas

VS - Bullish Breakout from MA200 TrendlineVS
Rst: 1.28
Spp: 1.23
Classic bullish formation, bullish engulfing rose above upper BB, widening BB and surging indicators plus the breakout from Fibo Extension 50% at 1.23 will charge the stock further to 1.44


VS buy on trend support with flag patternVS has another oppurtunity to enter at choppy market ,
already touch fib 0.618, oppurtinity to buy at support,
ep : 0.990
TP : 1.05. 1.14
CL : 0.950

VS - 3rd entry Re-enter with up momentum resume and target 6-8% profit.
(Disclaimer: for demonstrate own planned trade records study only, not for recommend to buy or sell. Please message me for the further detail trading plan)

VS Industry 21/6/2020 by Newbie Trading Channelvs 21/6/2020 chart tends to replicate their past movement all the time , are we seeing a similar channel here? Will it move to 1.250 area , where the major downtrend resistant line resisting here? Concern is the upcoming quarter report here, investors are still on the defensive side as the upcoming quarter report is yet to be announced.
DISCLAIMER: STOCK INVESTMENT INVOLVED SUBSTANTIAL RISK OF LOSS. MENTIONED STOCKS ARE JUST FOR RESEARCH, EDUCATIONAL PURPOSE. NO RESPONSIBILITY WILL BE TAKEN BY ANY PARTY

VS - 2nd entry chanceThe up momentum slowly resume, may test or break previous high
(Disclaimer: for demonstrate own planned trade records for study only, not for recommend to buy or sell. If you are interested on VT Trade system and can message me for the further details)

VS - End of Bull? Don't Panic, Read Our AnalysisVS
Rst: 1.12
Spp: 1.03
Doji formed above symmetrical triangle breakout level, BB still enlarging which indicates the upside still yet to fully unfold. Reaching MA200 is possible.

V.S IndustryRecently breakout triangle and retest triangle support.. Nak abis kan wave 3..Perlahan dan selamat.


Using PENNANT / FLAG Pattern to Predict Price MovementVS opened at a price of RM0.935, higher than closing price of previous trading day. The movement shows a bit of pullback to RM0.925. The price steadily moving up to highest price of RM1.08 before a slight pullback to closing price of RM1.07.
I am expecting profit taking from traders in the coming days and the price will continue to go fall until at least RM1.00. For the this purpose of analysis I would set RM1.00 as the strong support line for our chart to follow PENNANT / FLAG pattern .
If the traders maintains the price above RM1.00 with strong volume of higher than average daily traded volume for the past 1-2 weeks, we should expect the price to move up back to RM1.08. Bear in mind, the VMA200 (RM1.11) is the resistance needed to be broken. Once broken and is supported with increased buying pressure, our target should be RM1.15 in the coming days if not weeks.
Current Price: RM1.07
Support Price: RM1.00
Target Price: 1-RM1.11 2-RM1.15
Remember to trade with care. Please follow your own trading plan and risk tolerance level.

VS - BuyBreak up last few days resistance and up momentum resume.
(Disclaimer: for demonstrate own planned trade records for study only, not for recommend to buy or sell. If you are interested on VT Trade system and can message me for the further details)

VS BOLEH BOD?FA - DY(4.97%); PE (10) ; EPS (8.64)
S1 -
R1 -
EP -
CL -
DISCLAIMER :
Untuk tujuan pembelajaran sahaja.

V.S industry Looks like triangle wave completed.If this is valid, might see price will break the triangle. 1st target price will be 1.04 and long term target 1.23.

VS Industry BhdFor traders who are stuck in this stock, you may just want to continue to read this. Since you had been holding on to this trade, I would say hold on to a few days longer.
That's what I'll do if I were you.
A break and close below 0.895 might encourage me to prepare to cut loss.
Another level I will be looking closely is 0.915 to spot if it breaks and closes above the high if it does I will observe how the market react at 0.955

VS - Potential to surge if resistance is brokenVS - 13/05/2020
Previous gap has been fully filled up, but the price is moving sideways and consolidating. MACD and RSI are still bullish, we may see an upside potential if 0.945 resistance is broken.
Resistance: 0.945
Support: 0.840
Like & Follow:
1. FB page - BullBearBursa
2. Instagram - bullbearbursa_
3. Etoro - BullbearbursaFB

VS - Bullish Harami Candlestick VS
Trend: Bullish
Rst: 1.48
Spp: 1.40
Harami candle rose from immediate support level at middle BB, strength is losing in RSI & MACD. But as long the stock is staying above middle BB, it's considered safe to go.

{SWC}—— Potential Breakout Resistance in VS? Thank you for your continued support :)
Strategy: Bullish Pattern Formation
Bias: Bullish Ascending triangle is formed, in addtion, VS is potentially making a further Bollinger Band breakout (BB Breakout) with volume. The share price challenged RM1.40 resistance zone many times since 23 Oct 2019. The previous time it challenged the resistance was on 12 Dec 2019. In this case, it's clearly shown that RM1.40 zone is a major resistance zone which needs to be further broken in order for VS to scale higher!
If the buying interest kicks in with high momentum, potentially VS will make a successful breakout, with next resistance zone at RM1.50 and RM1.59 zone. Around 14% upside provided the breakout is valid. Support zone is priced at RM1.35.
Gentle Reminder: Plan your Trade, Trade your plan.
Kindly like and comment to support if you agree with this trading idea!

VS - Bullish Rounding Bottom BreakoutVS - HOLD
Trend: Bullish
Rst: 1.48/ 1.53
Spp: 1.43
Closed right at forecasted resistance level, as BB just started to widen & indicators continue to unleash its energy, expecting more upside.

<TradeVSA> VS & VS-C23 is Pulling Back Signal in the chart:
1. Failed Spring at Support
2. Pulling back lower to test next support
3. Low volume on downbar
Hit the "LIKE" button to support us :)
Disclaimer
This information only serves as reference information and does not constitute a buy or sell call. Conduct your own research and assessment before deciding to buy or sell any stock

VS BULLISH(IF BREAK SBR, MORE VOLUME IS PUMPING)1. VOLUME KEEP ON INCREASE SINCE EARLY 2019
2. MINOR TREND IS BULLISH
3. MA BELOW PRICE, STRONG UPTREND
4. IF BREAKOUT, MORE MONEY PUMP IN, MORE INCREARE OF VOLUME
4. ALERT OF MACD CROSS

<TradeVSA> Pullback in VS...Potential to trade in VS-C23 (Macq)?Strength in the chart:
1. Mark-up stage with pullback
2. Low volume downbar
3. Testing at support now
Disclaimer
This information only serves as reference information and does not constitute a buy or sell call. Conduct your own research and assessment before deciding to buy or sell any stock
