WCT, Front runner of ECRL-Port Klang extension.C : Front runner of ECRL-Port Klang extension.
E : Masih dalam fasa keuntungan + AR lepas increasing. Order book forcasted to be increasing this year.
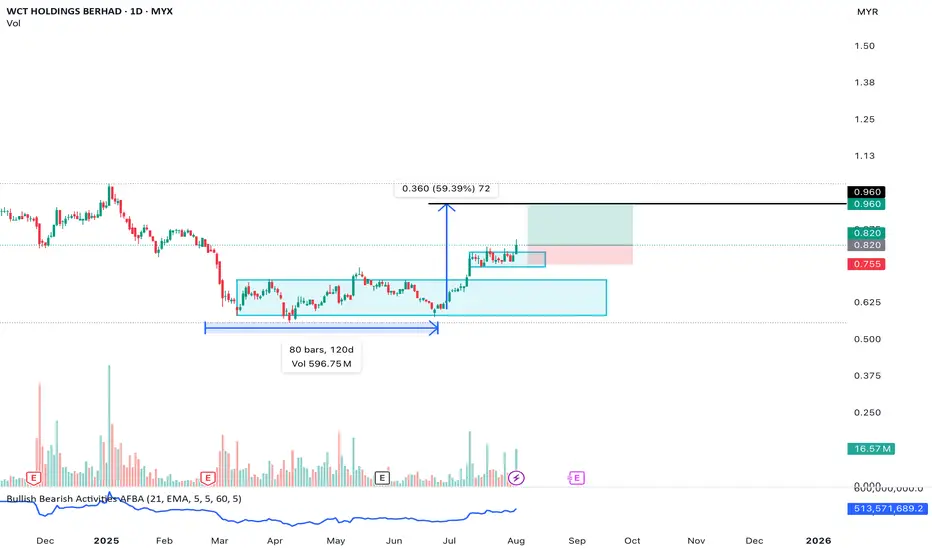
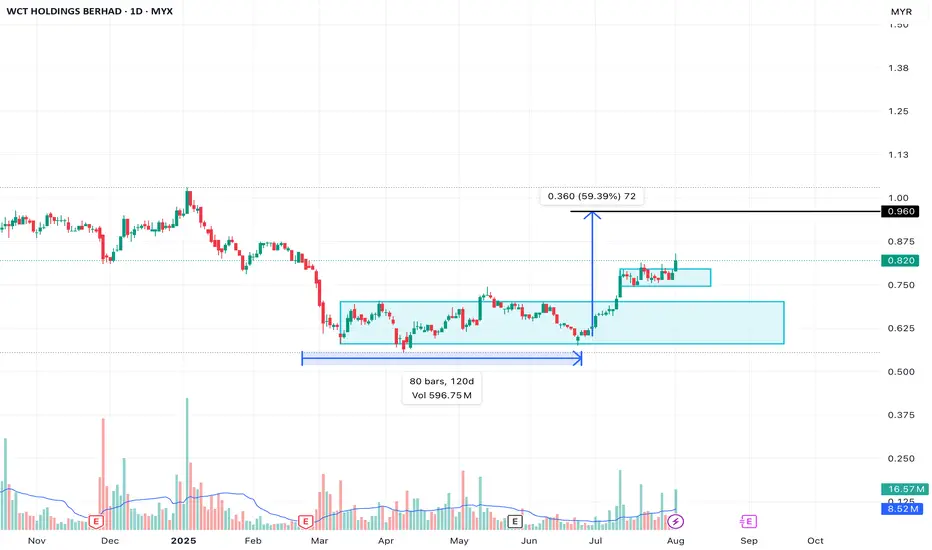
V : FV analysts minima RM0.96, MIDF. RM1 ke atas other banks. PE kasar 4.7.
W : Breaking out from BUA.
I : Currently ada. Tapi tak dapat cari transaction yg latest.
T : Buy BO BUA, cut loss bila price invalidate the structure.
WCT trade ideas
WCT, front runner of ECRL-Port Klang extension.C : Front runner of ECRL-Port Klang extension.
E : Masih dalam fasa keuntungan + AR lepas increasing. Order book forcasted to be increasing this year.
V : FV analysts minima RM0.96, MIDF. RM1 ke atas other banks. PE kasar 4.7.
W : Breaking out from BUA.
I : Currently ada. Tapi tak dapat cari transaction yg latest.
T : Buy BO BUA, cut loss bila price invalidate the structure.
Technical Analysis - WCT1. Price candle has move downtrend, now touch MA200 line. To complete sub-wave 4.
2. EP possible when price candle break the downtrend line to target sub-wave 5.
3. This technical analysis utilize MA line+EW+Fibo+trendline

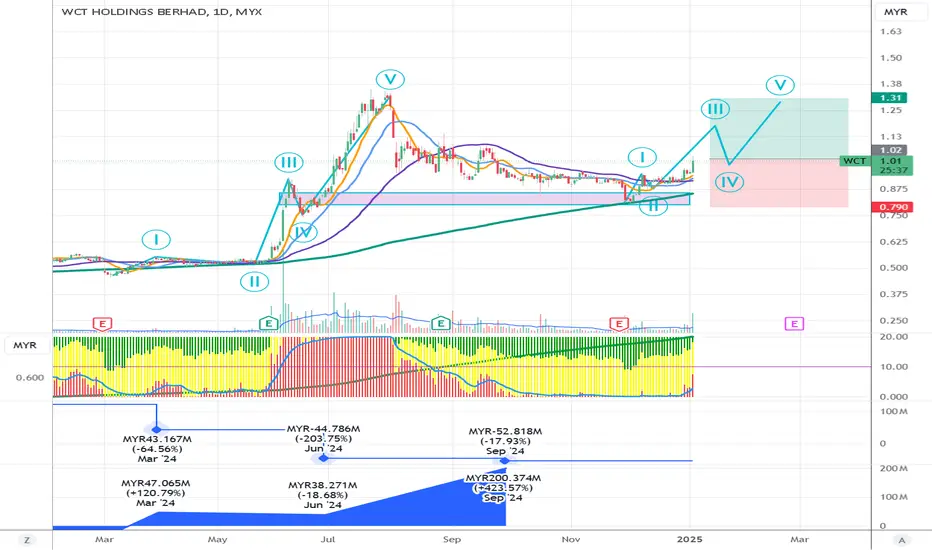
WCT is in wave 3Looking at the chart for WCT Holdings Berhad, here's my analysis:
Current Price Action:
- Trading at RM1.00, down 2.91%
- Currently in consolidation after recent breakout
- Price above key moving averages indicating bullish trend
Elliott Wave Analysis:
- Completed waves I through IV
- Setting up for wave V move higher
- Wave V target projected around RM1.31
Key Technical Levels:
1. Support:
- Strong support at RM0.790 (wave IV low)
- Secondary support at RM0.875 (previous resistance turned support)
- Moving averages providing dynamic support around RM0.95
2. Resistance:
- Immediate resistance at RM1.06 (recent high)
- Major target at RM1.31 (wave V projection)
- Psychological level at RM1.00
Notable Events:
- September 2024: MYR-52.818M (-17.93%)
- June 2024: MYR-44.786M (-203.75%)
- MYR200.374M (-423.57%) significant movement in September
Trading Considerations:
- Currently testing support at moving averages
- Stop loss could be placed below RM0.90
- Risk/reward favorable for wave V target
- Volume profile showing potential accumulation
WCTAlgo TradingSystem by Remisier CheDin
The current market conditions, as identified by my algorithmic system, indicate potential upward signals. These signals include increased trading volume, an upward trend with prices above the EMA20 and EMA50. Consequently, the present conditions suggest a possible upward trend.
It's crucial to remember that trading strategies account for only 10-20% of your overall trading success. The majority of your success depends on effective risk management. This involves having a well-defined trading plan and appropriate position sizing, which are essential for maintaining the right trading psychology. Master your risk management and trade according to your plan.


WCT, Uptrend based on AlgoSignal Strategy The current point exhibits upward signals according to my algorithmic system, meeting various criteria. These include rising trading volume, an upward trend indicated by prices above EMA20 and EMA50, and the closing price surpassing VWAP. As a result, the present conditions suggest a potential upward trend.

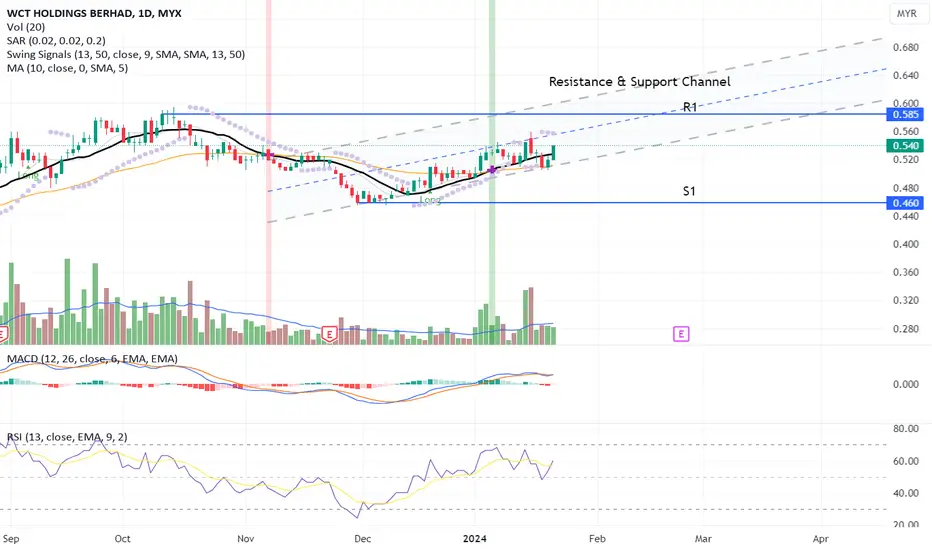
Consistent Uptrend Momentum!The candlestick indicates a price fluctuating between consistent highs and lows as indicated by the resistance and support channel whereas the channel benefits as a guideline to predict price peaks and troughs. The price is within the lower channel and provides a buying opportunity.
From the previous trades, there was no significant result in volume. Where the volume hasn't yet crossed above the MA line although price action is in place.
MACD and RSI indicate a divergence signal that is aligned with the candlestick uptrend toward the next price resistance.
Let's save WCT in WL and watch out for price action with result in volume crossed above the MA line.
R 0.585
S 0.460
WCT, come back or...?>> Possible for it to break above FVG?
>> Need to break the Parallel Channel too.
>> Stochastics is OB. May pullback and find strong support around 470 are.
When the market moves where, and how, and if - these are all unknown. The only thing which we can control is our risk. Focus on risk management!
Keep the long term vision.
Disclaimer: Mentioned stocks are solely based on own opinions for education and/or discussion purpose only. There's no buy and/or sell recommendation. Trading involve financial risk on your own. The author shall not be responsible for any losses or lost profits resulting from investment decisions based on the use of the information contained herein.

WCT - TA1. Price candle break out MA 200 on 29 Mar '23 give strong signal the price movement may change direction to bullish soon.
2. Price candle testing MA 200 on 9 May '23 to 3 July '23 to shake out weak retailers. Price candles break out MA 200 again on 4 July '23.
3. GC (Golden Cross) MA 50 & MA 20 happen on 13 July '23 give another strong signal the price is build up the uptrend momentum and ready for bullish.
4. Price candle and MA 200+MA 50+MA 20 has aligned altogether give sign the price is ready for bullish.
5. Price candle has BO strong resistance (0.450-0.465) on 11 Aug 2023 and PB take place to setup a support area at the same price range. This the 1st EP.
6. Two propose EP stated in this WCT TA. 1st EP already happen. Right now, price candle move to next strong resistance. Price may PB to form a new support and this is a possible 2nd EP once the price candle BO and closed above CMT.
7. EW count analysis includes in this TA together with sub wave count. Target wave 3 is still far away. Lot of chances to entry this counter when price candle PB to MA 20/MA50.


long WCT head and shoulder breakout in weekly chart. long the counter at this right timing. monitor the volume carefully, need more volume to push up.

WILL WCT FORM A BUTTERFLY PATTERN?Wathout if price BO from point B.
It will formed Bearish Butterfly Pattern when price achieve at point D and price should not below from point C.
#TAYOR MYX:WCT

<TradeVSA> Breakout is coming for Syscorp ?Sign of Strength in the chart:
1. Pocket Pivot with low volume pullback
2. Reaccumulation stage
3. Green Pentagon in Weekly Chart
Disclaimer
This information only serves as reference information and does not constitute a buy or sell call. Conduct your own research and assessment before deciding to buy or sell any stock

Strong Uptrend Pattern!The candlestick pattern indicates a strong uptrend pattern. Hence, with a high possibility of price momentum uptrend. OBV chart also indicates a positive uptrend with cumulative total volume when the price is higher. To place a bid, use VWAP as a guideline and place your bid below VWAP line.
R 0.775
S 0.675

WCT Holdings Berhad - Buy on DipAfter reach its first 52WH at 0.650, it went for a short term pullback and resting at previous resistance at 0.620.
New support 0.620.
Start my entry at 0.630 and now reaches 0.680. = 7.8%
classic technique on Buy on Dip.
X to X TP = 0.90
Complete Cup and Handle. Now on its way to Mark up phase.


WCT - COMPLETING WAVE 5 OF (3)The trend would be continue for the next period.
We would wait for some correction to our Entry Level.
Good luck

WCT - Mark Up in ProgressWCT recently break 52W high with bigger volume.
WL for pullback with less volume above 52W high to confirm as RBS.
This counter also indicates uptrend movement with EMA stacked above each.
TAYOR

VCP SETUP WCTSector : construction.Technically just breakout from pivot point with high volume,prior to that forming shakeout and base reset.Fundamentally reducing QOQ,but improving YOY sales and profits.

WCT VCP Follow UpFollow up on WCT VCP development.
Back then in July the breakout is not successful and it develop contraction up to 13% (C3).
I believe C4 will form before it fully take off. Let's monitor together.
C1: -24%
C2: -13%
C3: -13%
C4: Waiting...
Disclaimer:
Not a buy call, just chart pattern and technical analysis sharing. Trade at your own risk.

WCT - breakout resistance CCMTIMWELL - There is a candle that has breakout the resistance (highest price) of CCM. Referring to the EPRAF indicator, the price will start to rise when there is a candle that manages to break the CCM resistance. With the newly crossed MACD situation and high stochastic levels, the WCT seems to be ready for the uptrend phase.

WCT VCP Setup!!REPOST due to previous post is hidden as it violate trading view house rule to have link in normal account. I have remove the link in this post.
This week quite excited as i discovered another 3 counters with crispy VCP setup to share with you all.
Here you go for the first counter, WCT with 3 contraction of
C1: -24.28%
C2: -13.74%
C3: -6%
The huge volume on 14 July related to court case winning with Dubai... Can search back the related news.
According to this chart, something is cooking! Similar to HONGSENG , chart move first before news.
Disclaimer:
This sharing is based on my technical analysis experience. Not a buy call. Trade with your own risk.
