Wellcal Holdings Bhd to Challenge ALL TIME HIGH?A bullish continuation pattern can be seen as the price continuously making series of Higher Highs and Higher Lows.
For the past 2-3 months, price formed a pullback after the Break of Structure reaching RM 1.87 as the new 52 Weeks High.
There are three key things that are worth to be observed:
1. Price rebounded at MA 200 confluence with the Order Block zone.
2. In TF15m, price made Change of Character (ChoCh) at RM 1.59.
3. A bullish divergent pattern can be seen as price is making Higher Low and the Awesome Oscillator Lower Low suggesting that price will shift upward.
If price can sustain and close above RM 1.70 will strongly validate the ChoCh in the TF15m with a minimum target at the previous high RM 1.87 and a breakout above it, with the target at the All Time High level.
A break below RM 1.53 is a sign that price will further resume the bullish pullback whereas if broke below RM 1.43 indicates the ChoCh from bullish to bearish.
Disclaimer:
The information provided is for educational and informational purposes only and should not be construed as financial advice. Before making any investment decisions, individuals should conduct thorough research and consider their financial situation, risk tolerance, and investment objectives.
Investing in stocks involves significant risk and may not be suitable for all investors. The value of stocks can fluctuate and may result in partial or total loss of investment capital. Past performance is not indicative of future results.
Furthermore, the content provided does not constitute a solicitation or recommendation to buy, sell, or hold any particular security or investment strategy. Investors are encouraged to consult with a qualified financial advisor or investment professional before making any investment decisions.
All investments carry risks, including the risk of loss of principal. Investors should be aware of the potential for volatility, market fluctuations, and geopolitical events that may impact the value of their investments.
Investors are solely responsible for their investment decisions, and any reliance on the information provided is at their own risk. The author and publisher of this disclaimer disclaim any liability for any direct, indirect, incidental, or consequential damages arising out of or in connection with the use of the information provided herein.
WELLCAL trade ideas

WELLCALL. AlgoSignal reveals potential uptrendSeveral indicators within my algorithmic system are signaling a potential uptrend. These include:
- Increased volume: Activity is picking up, suggesting growing interest and potential momentum.
- Mid- to long-term uptrend: Both the 50-day and 150-day exponential moving averages are pointing upward, indicating a sustained positive trajectory.
These factors collectively point towards the possibility of an upward movement in the near future

WELLCALL. Uptrend based on AlgoSignal StrategyThe current point exhibits promising upward signals according to my algorithmic system, meeting various criteria. These include rising trading volume, an upward trend indicated by prices above EMA20 and EMA50, and the closing price surpassing VWAP. As a result, the present conditions suggest a potential upward trend.


Monthly, Weekly, Daily projection on WELLCALLThis is based on monthly, weekly and daily analysis.
If you're buying, green zone is the TP
If you're selling, red zone is the TP
Monitor for price reaction at every zone, either the candle reaction in that zone want to breakout the zone, or the candle reaction want to test/pullback at the zone.
All the best.


Wellcall - break upWellcall - break up done, Up trend may continue
VT Stock indicator is a stock breakout trend indicator for identifying the change of Mid to long term trend direction
(Disclaimer: for demonstrating own planned trade records study only and education purpose, not for recommend to buy or sell. Trade at your own risk)

VCP SETUP WELLCALLA strong base company,in industrial product sector.supported by institutional.Increasing sales and profit QOQ and YOY.Price just breakout from pivot point with high volume
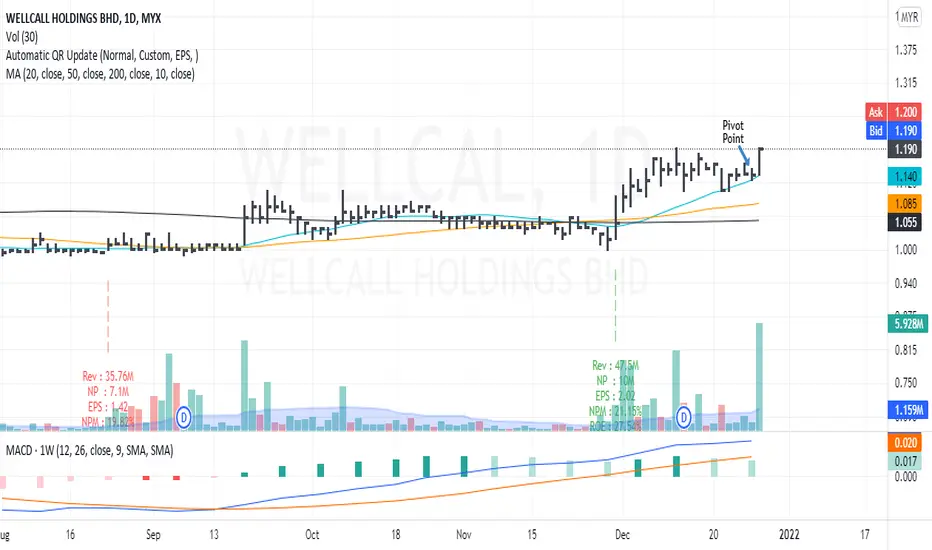
Price maintain above MA linespossible retest support level at 1.19 and continue moving upward..we'll see

Wellcall long term down trend breakaoutMYX:WELLCAL
1. Price chart breaking long term down trend line since 2016.
2. Breakout from sideway box 1.13. If back test can stand above 1.13, uptrend more convince.
3. MACD and RSI good positive look.
4. Volumne analysis show no major resistant until 1.25.
Once break and stand above 1.25 can be long term uptrend.
Welcome to express your view as for investment study purpose.
Trade at your own risk. Information should not be considered as an offer or enticement to buy, sell or trade. You should seek appropriate advice from your broker, or licensed investment advisor, before taking any action. Past performance does not guarantee future results.


WELLCAL SIMPLE ABCDD point is Fibo Extension within 1.13% and 1.27%.
cutloss is next Fibo ext 1.41%.
Targeted price is Fibo retracement point C to point D within 0.382% to 0.618%.
#complete MYX:WELLCAL


Trend Rider 51. TR setup at H4, weekly EMA 12 above EMA 36. Haven't touched EMA and not really significant break, but retrace nicely at RBS.
2. Trendline uptrend and just touches and reverse up.
3. Doji formed and break with bullish candle. Potential reversal at the area.
4. BM Rating 10, Average Target price from i3investor 1.27

WELLCAL - Pre Consolidation BreakoutNO INVESTMENT ADVICE IS PROVIDED
DISCLAIMER
Please consider your own interpretation of Opportunity & Risk. The author of this post strictly follows the Malaysian Security Commission ( SC ) Guidelines on the prohibition of Investment Advice by unlicensed parties. Any examples shall use historical charts without any recommendations and not to cause inducement to the public to take action or position (e.g. buy, sell or hold) regarding a particular class, sector, or instrument in relation to securities or derivatives. The author will never provide any investment or trading advice as the activity of giving investment advice is likely to be considered as a regulated activity under the Capital Markets and Services Act 2007 ( CMSA ). All posts made in Tradingview do not include any communications involving providing recommendations or opinions or includes any material, content or any statement which are likely to induce a person to take any action or position (e.g. buy, sell or hold) regarding a particular class, sector, or instrument in relation to securities or derivatives that is likely to be considered as “advising others concerning securities or derivatives”. The author will not recklessly make any statement, promise or forecast that is misleading, false or deceptive to induce or attempt to induce another person to deal in securities or derivatives. None of information posted in post can be used as investment decisions. Do not trade solely on the information posted. Trade at your own risk and judgement. A trader could potentially lose all money. Only risk capital that can be lost without jeopardizing ones financial security of lifestyle. Please seek licensed professional guidance if you plan to invest your capital seriously.

Buy Call For WELLCALThe rebounds were howering above 200ma. 20ma is about to cross 50ma again. EP: 1.1-1.13

Wellcal to rise in long term.In weekly chart it looks to retrace but in monthly chart its set to rise. MACD indicator to overcross in monthly chart, yet it might continuing retrace for a while. Fundamentals looks good as they cant be affected much by Covid-19.


wellcal-buy for long term?macd crossing,hot money just in on 4H TF
Fundamental is awesome,maybe can make jeruk?


Wellcal - Waiting for breakoutBig YELLOW Trapped Volume
Retailer's Volume Reducing
Banker's chip getting stronger but still below 25%
Ribbon is green
Volume is building up
Accumulate
