WIDAD over one month at the resistanceGann Support: 0.34/0.31 | Resistance 0.37|0.40
Trade at high volume near the resistance over one month.
Hopefully can break the first resistance and become bullish.
One year target price is 0.40 and long term target price is 0.47
Analysis based on my hope only. No need to trust this analysis.
WIDAD trade ideas

WIDAD IN BEARISH BAT HARMONIC PATTERNConsider to study, analyze and monitor WIDAD as it attempts to cross fibo886 in what appears to be a bearish bat harmonic pattern. Potential swing trade can be taken from fibo886 (Point C) to fibo886 extension (Point D). CL is below 52-week low.


Double Bottom - Buckle up! 🎢Widad was dipped by 50% from Fibonacci resistance area at 0.80 and found support at Fibonacci sell target 1.618 at 0.39, forming a Double Bottom reversal pattern. A bullish bias has emerged above the Double Bottom as the price has violated the downtrend line followed by a stronger buying volume coincide with buy signal seen on daily Stochastic . Theoretically, the target price of a double bottom is measured by the height of the pattern.
Meanwhile, a reversal below support level 0.39 would negate this expectation.
Disclaimer: No trading strategy provided here. Our content is intended to be used and must be used for technical analysis education purposes only

WIDAD - a possible longWidad is going to make a double bottom and it could react to that.
the reaction to that could make as a retracement to the long fall that happened this couple of weeks.
I'm biasing a bullish here.
==========================================================
Always take care of your MM.
Think of the value STOP LOSS first rather than the value of your TP.
All in all, good luck in your trading!
===========================================================


WIDAD - ideas updateNote
_ Some potential stock counter this week. Seek for best entry/exit. Suggestion are on the charts


WIDAD 1 HOUR1 hour timeframe
possible ABC strategy
entry at 0.520 - 0.525
SL. 0.500
TP 0.555 / 0.560 / 0.570

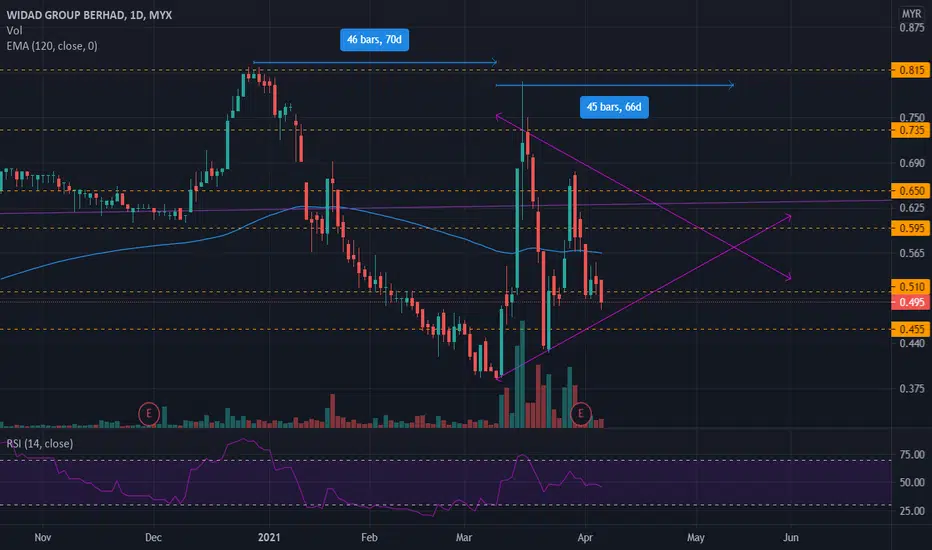
Up or Down, let seeThis is a very interesting stock, which it had been dropped 50% for 3 months in early 2021. And starting to rebound and dropped and rebounded.
By seeing the rebound pattern, it has formed a triangle which trend direction is still unclear. But the graph may bound inside the triangle forming top breakout, or dropped lower.
EMA 120 shows 0.565-0.570 which separating the direction of the trend.
It is interesting to keep in view.
WIDAD Going ImpulseHello Traders
Here is one of promising chart to trade. WIDAD will soon going impulse
Don't forget to take this trade

WIDAD Hourly TimeframeTriangle is working good...
Compression in the making....
Explosion on the way?
Trading Plan ? = waiting for the Shark, follow the Shark...


WIDAD Gonna make it?can TP 13% deal or no deal
MACD Cross over to the making
lets see after 30days hehe

Bull-riding Roller CoasterChart 1
A helicopter view on weekly timeframe (Chart 1), we can see the Bullish market structure with formation of Higher Highs and Higher Lows. In July 2017 the price reacted at Fibonacci Target 4.236 and plummeted to support level at 0.22. The price was consolidated for two years, before surging higher forming new ATHs. Our view is Bullish here.
Chart 2
The share plummeted again from new ATH at 0.82, found support at Fibonacci sell target at 0.39 and rose dramatically to Fibonacci target 2.618 at 0.80, however dipped down to support at 0.55.
Conclusion:
Our view is still bullish. Support level at 0.55 could be a rebound point for the price to climb higher. However, if breached, next support is at 0.385. If again, the price breached this level it could drop to S3, and finally S4, which violation below this level assumed bullish reversal is confirmed.
Disclaimer: No trading strategy provided here. Our content is intended to be used and must be used for technical analysis education purposes only.


WIDAD buy on weaknessStoch 15 minutes already oversold. Can prepare to enter.
Bollinger squeeze we enter.
*Not a buy call


Short term BearishWIDAD closed on support level at 0.61 today with a Bearish Marubozu candle. The price could bounce from this level, but more likely to drop lower to sell target at 0.56.
Disclaimer: Our content is intended to be used and must be used for technical analysis education purposes only.

Bullish Butterfly Identified 17 Nov 2020, Breakout 10 Dec 2020Bullish Butterfly Identified on 10 and 17 Nov 2020.
Breakout on 10 Dec 2020 and has trading above its sloping 20-Days Moving Average which is a good sign.
Resistance 1 : 0.680 (23 Oct 2020)
Resistance 2 : 0.675 (4 Nov 2020)
Support 1 : 0.635 (19 Oct 2020)
Support 2 : 0.620 (10 Nov 2020) - 1st Bullish Butterfly
Support 3 : 0.615 (10 Nov 2020) - 2nd Bullish Butterfly
Ascending Triangle prediction at 11 Dec 2020.
Possible bullish price movement towards the resistance 3.69 within the next 94 days (65 bars : ETA 15 Mar 2021).

WIDAD: SR FLIP TO TEST 0.680?Widad is possible BOD (buy on deep) @ SR Flip Price Action Level. RSI is on the good territory to bounce back. Possible bounce and retest the previous resistant line @0.680 in short term.
TAYOR!
