Wong, monitor for trading opportunityThe current point exhibits upward signals according to my algorithmic system, meeting various criteria. These include rising trading volume, an upward trend indicated by prices above EMA20 and EMA50, and the closing price surpassing VWAP. As a result, the present conditions suggest a potential upward trend.
WONG trade ideas

WONG buy signal based on MRV1 setup on 5 Jan 24 at RM0.235
The support level is around RM0.295, but a safer stop loss would be RM 0.285 to avoid getting stopped out prematurely
The resistance level is around RM 0.350, followed by RM0.410, but the target price is set to RM0.390 to ensure a 1:2 risk/reward ratio
The holding period is estimated to be 2-3 months based on the daily chart signal
Be careful as this is a low-volume stock and may have high volatility
This information is for discussion purposes only and is not a buy/sell call.

WONGPros:
-short uptrend market
-accumulation days>distribution days
-low risk entry
-big volume on accumulation days
Cons:
-financial (eps&revenue) not good
-price a bit volatile from my perspective
-below 200MA and 2x fake BO

WONG in VOLATILITY REVERSAL AT EW ABC CORRECTIVE ZONECan try to take a long position of WONG which has been spotted to have reversed its volatility in daily time-frame at Elliott's Waves' ABC corrective zone which has completed the 5 patterns.

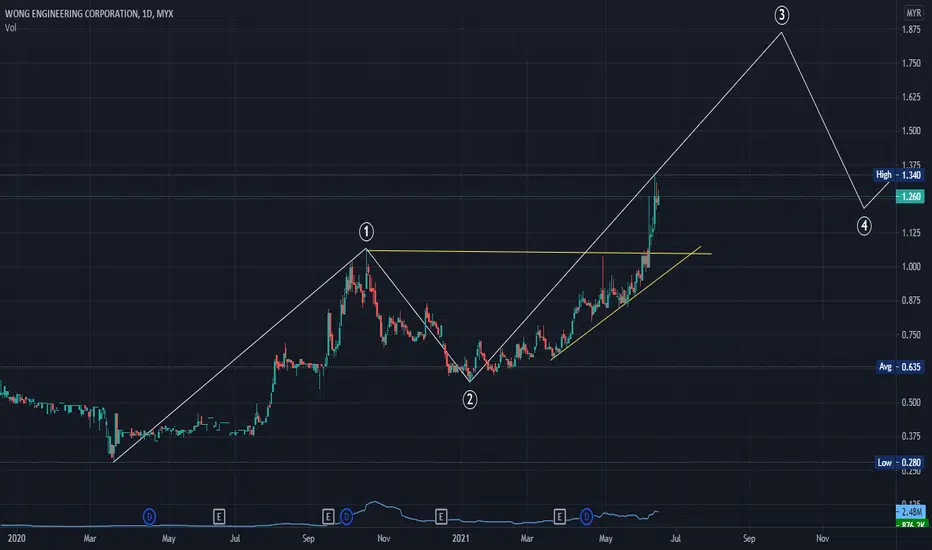
My Predicrion on Wong: Triangle CorrectionWill it goes to Impulse Wave 5 after this, wait for completion of Triangle Correction first (ABCDE). S1:0.62 R1:0.82. 52w H/L 0.986/0.286
Wong engaged in the manufacturing of stamped and turned metal parts and components, welded frame structure, related modules, and systems as well as trading, marketing, and retailing of industrial and consumer products. The Company offers a range of services from design to development and produce metal fabricated parts. Its products range from industrial frames, rack, chassis and cabinets, faceplates and mount brackets, valves, couplings and machining components, shields and heat sinks. The Company serves various sectors, including electrical and electronics (E&E), semiconductor, test instruments, telecommunication, digital imaging, healthcare, and oil and gas. Its subsidiaries include WEC Marketing Sdn. Bhd. and WEC Construction Sdn. Bhd.
TAYOR BAYOR YOR

A Divergence Signal!RSI indicates a divergence signal although the candlestick shows a sideway pattern without forming any distinct price trends over some period of time due to the accumulation of the stock by the operator.
MACD and OBV indicate an early sign of divergence signal. Hence probability it is a good position to bid before significant price movement towards the MA20 line.
To place a bid, use VWAP as a guideline and place your bid below the VWAP line.
Let's watch out WONG for significant price movement with volume
R 0.695
S 0.610

A Reversal Signal!RSI and OBV indicate a divergence signal and confirm the price momentum to the next resistance price level.
The MA20 line already crosses over the MA50 line which indicates a probability of a strong uptrend pattern.
Let save WONG in WL and watch out for significant price movement with volume supporting the price momentum.
R 0.710
S 0.610

WONG COMPLETING WAVE 3Looks like WONG is moving upward towards completing minor wave 5 for major wave 3 after recent breakout. TRADE AT YOUR OWN RISK


A Strong Uptrend Momentum!From the OBV chart, WONG is in a strong uptrend state where volume is in uptrend momentum with the price is already above the MA50 line. Which has the potential for an uptrend towards the peak price.
MACD chart is in a positive state and confirmed the uptrend.
Let put WONG in WL and watch out for significant price movement
To place a bid, use VWAP as a guideline and place the bid below the VWAP line.
R 0.835
S 0.720

Does WONG want to break his All Time High record?Referring to the EPRAF indicator in TF 1 Week, the green line has started to bend upwards as if to intercept the purple line. This is an early sign of a change in price movement before the uptrend phase begins. Let us witness the resurrection of WONG.

A Reversal Signal!A significant price movement on recent trade makes the candlestick body in a reversal signal.
MACD and OBV charts indicate a divergence signal with a high probability of an uptrend pattern.
The weekly timeframe also indicates a positive uptrend momentum.
Let put WONG in WL and watch out for price movement crosses up the MA20 line which indicates a strong uptrend pattern.
R 0.630
S 0.570

A Breakout Signal!A significant price movement with volume above MA20 from recent trade indicates a price breakout signal. MACD and OBV charts indicate a divergence signal hence a high probability at the beginning of the uptrend pattern. Using Bollinger Band (BB) chart, the price candlestick closed above the BB upper level. The price weekly timeframe indicates a positive uptrend pattern.
Will the price be able to continue the price rally-up momentum or have a price correction before continuing with the price momentum?
Using Volume Price Action (VPA), the price Point of Control (PoC) is RM 1.84 which is above the VWAP line. Therefore, high probability the price will be rally up on the next day trade.
Put WONG in your WL and watch out for significant price momentum with volume. To place a bid, use VWAP as a guideline and place a bid below the VWAP line.
R 2.030
S 1.770

WONG In Correction Regular FlatOn The Way to B , This is from my view. The other may have their own view and lets compare among the different views.

Wong - mungkin ke 2.30Wong - mungkin ke 2.30
7 Ock 2021 volume yang banyak
sokongan - 1.50
rendah yang lebih tinggi, uptrend

Wong Engineering _retracement before bounce backWong expected to retrace in the short term before continue LONG journey. Fundamental BUY.
Note: This is not a Financial advise.


Wong menuju puncak Wave 31. Breakout from the neckline @ 1.040
2. Bacaan momentum looks good
3. RSI: > 50
4. Stoch: menghampiri overbought area
Disclaimer
Any information contained in this page should be considered as general information, research and learning only. I am not responsible for any actions and decisions made based on the information from this page. Thank you
Wong (KLSE 7050)Pennant chart pattern breakout with increasing volume profile. Any retracement would be an opportunity to go long.

WONG is ready to climb???MYX:WONG Refer to the EPRAF indicator, WONG has just started the uptrend phase when the green line crossed the red line on 13 August 2021. This is an early indication for WONG to start the climb.


WONG - Still in UptrendWONG
Rst: 1.59
Spp: 1.36
Healthily supported by Fibo Ext 100% even it faced 3 rounds in selloffs the past 5 days, bull is in strong grip and shall see further upside be unfolded towards 1.59

