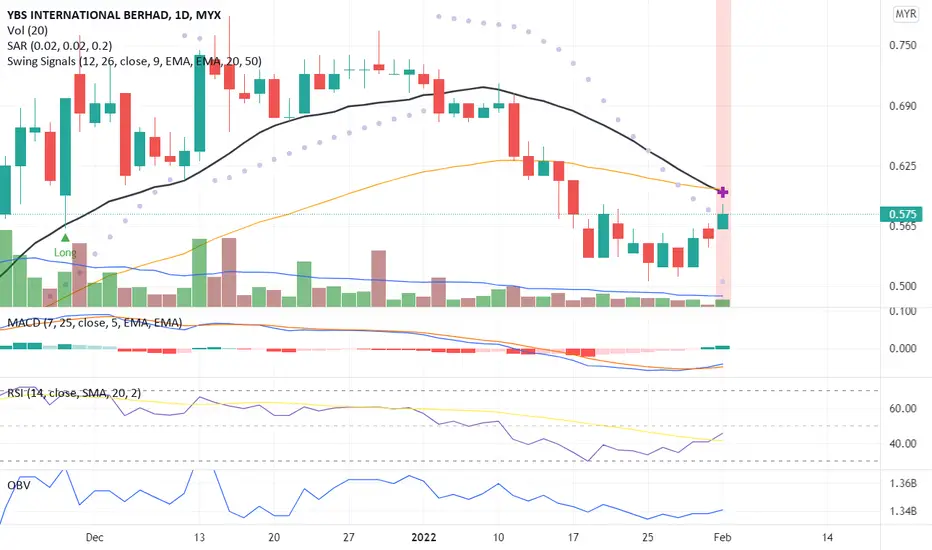
IS YBS GOING TO MARK UP PHASEvery typical of wyckoff re-accmulation (Schematic #2, Rising Bottom)
latest price action, already reaching the selling zone of composite operator
Thus, in view of that, position initiated today as attached
Pure Wyckoff
YBS trade ideas

YBS in Stage 3?Based on the chart, it looks like the stock in the stage 3 but also can be a consolidation. Even though the stock in stage 3, there is a possibility the stock to continue to move upward within the stage 3 range, before it move to stage 4. But, there is also a possibility that this is just a consolidation phase before it moves higher and break above major resistance. Anyway, I think that this stock has a nice setup on weekly chart as it trying to rebound from the oversold region and cross above MA50.

YBS, trade inside the box?W chart : it seems like trade inside the rectangle box 🤔 able to breakout? Perhaps not this round.
What is good about this? A signal that price range inside the box, bad is, profit also at that range. 😅
D chart: might pullback to find base. Whoever trade it must be caution. Up again to form LH? Protect downside as always. Price may down in nearby days.
I'm always looking for OB and OS. Supply and demand. Simple as that.
Disclaimer: Mentioned stocks are solely based on own opinions for education and/or discussion purpose only. There's no buy and/or sell recommendation. Trading involve financial risk on your own. The author shall not be responsible for any losses or lost profits resulting from investment decisions based on the use of the information contained herein.

YBS BreakoutToday, YBS breakout from the resistance RM0.595 with large volume. Based on weekly chart, we can see right now the stocks make a bullish engulfing support with large volume. Not only that, the stock shows a signal of rebound from oversold region as well as start to breakout from MA50. This might be a good start for YBS.

YBS Just Need to Make a Resistance Breakout 0.595When we look at daily chart, the stock moved like a staircase pattern which is looking good but, we need to wait for confirmation first in order to be safe. Therefore, I think that this stock can go higher if it break the resistance of MYR 0.595. It is much better if it break the resistance tomorrow because, it will make both daily and weekly chart looking good.

Backtesting Naked Chart AnalysisThis analysis consist of multi timeframe analysis and changing between candlestick and line chart. The price has broken those 2 Monthly Resistance colored as red line showing strong buy. Expecting pullback price. The price reach the Weekly Support colored as orange line and it close above the support. Then we go to Daily time frame to entry. There is a continuous bullish trendline. Can directly entry there back then, but if missed the setup, there is an inverted Head and Shoulder which showing strong bullish and that is the best entry with minimum risk maximum reward. This is totally technical analysis without combining fundamental analysis. I bought this stock for my competition #Tradingcupinvestingnote.

Diagonal Triangle Pattern (Continuous Pattern)The pattern has completed make ABCDE pattern and set TP between 0.695-0.710. The uptrend may resume with the next resistance is 0.765 and observe if can break 0.800 to make new ATH price.


<TradeVSA> Make Safe, Smart Trades with These PatternSign of Strength in the chart:
1. Reversal setup with Strength bar
2. Pullback with NS near support level
Disclaimer
This information only serves as reference information and does not constitute a buy or sell call. Conduct your own research and assessment before deciding to buy or sell any stock

YBS struggling to break wave BYBS struggling to break wave B at 0.670 for confirmation uptrend. If success, there will be a correction wave (testing support) before proceed to setup wave 3.

BREAK UPPER TRENDLINE YBSIncreasing EPS QOQ and YOY.Price just break the upper trendline with high volume.

volume tiba-tiba spike1. ikut pengalaman lps, jika volume spike di TF1hr antara pukul 3-4 esk akan sambung naik.
2. TF weekly BBD hijau & price atas ema5. kemungkinan mencari 52wk 0.78.
3. Pada TF1hr banyak signal buy terkumpul.
4. jika drop monitor pd 0.65

An Uptrend Pattern!The candlestick body indicates the price is towards an uptrend pattern.
MACD and OBC indicate a divergence signal with the possibility of uptrend momentum.
RSI crossed above 30 hence indicating a positive uptrend momentum.
Let's save YBS in the WL and watch out for significant price movement with volume.
R 0.600
S 0.540
A Breakout Signal!Due to high demand on YBS, the candlestick body indicates a breakout signal with volume above the MA20 line confirmed the trend.
Will YBS able to continue the price momentum up or have a price correction in the next trade? Using the Volume Profile indicator as a guideline the PoC is 0.710. Therefore, a high possibility will have a price correction. Precaution where the expectation of having a price correction ~10% from the current peak will minimum sell volume.
MACD and OBV charts indicate a divergence signal hence with MA20 above MA50. It is a high possibility of a strong uptrend.
Let put YBS in WL and watch out for significant price movement with volume supporting the uptrend.
R 0.820
S 0.635

YBS POWERPLAY SETUPYBS observed to have strong price and volume action since Nov. Price surge >100% and retracement less than 25% with healthy volume.
Will it continue to attack? Previously i shared OPCOM Powerplay setup manage to gain 40% (can refer to link below)
Disclaimer:
Not a buy call recommendation, just a sharing in technical analysis with chart pattern based on my personal trading experience.


YBS VCP SETUPNot a great company,however recent quarter report showed increasing QOQ and YOY sales and profit.Technically recently broke out from pivot point of low cheat setup.Currently forming a new base after breakout.Lets watch what happen after this

Continue Strong Uptrend Pattern!The price set a new high peak record with volume confirmed the buying momentum.
MACD and OBV charts confirm the uptrend pattern.
Using price and volume analysis there is no sign of price correction when buying momentum exceeds selling interest. However, extra precaution is required since the candlestick body is closed outside Bollinger Band (BB).
To place a bid, use VWAP as a guideline and place the bid below the VWAP line.
R 0.700
S 0.600

Strong Uptrend Pattern!YBS candlestick indicates a strong uptrend pattern with volume support confirmed the price movement; a fishtail from Bollinger Band (BB). Beware of a price correction where the price will be pushed inside upper level BB. To place a bid, use VWAP as a guideline and place your bid below the VWAP line. Put YBS in your WL and watch out for price momentum with volume to support the price movement.
R 0.69
S 0.47

A fake bull of real bullAnticipate the will be a downtrend if the price action unable to sustain. wait for T3 signal

As expected YBSHarmonic Butterfly Pattern matched
TP1 at 127% after BO from point B.
#scalping
#Momentum MYX:YBS

YBS againuptrend movement with high volume
with a gap up and above BB range
MACD cross over 0
RSI bullish upward >50
looks like a good buy but have to measure high risk taken since the last price move unexpectedly.

