YTLPOWR trade ideas
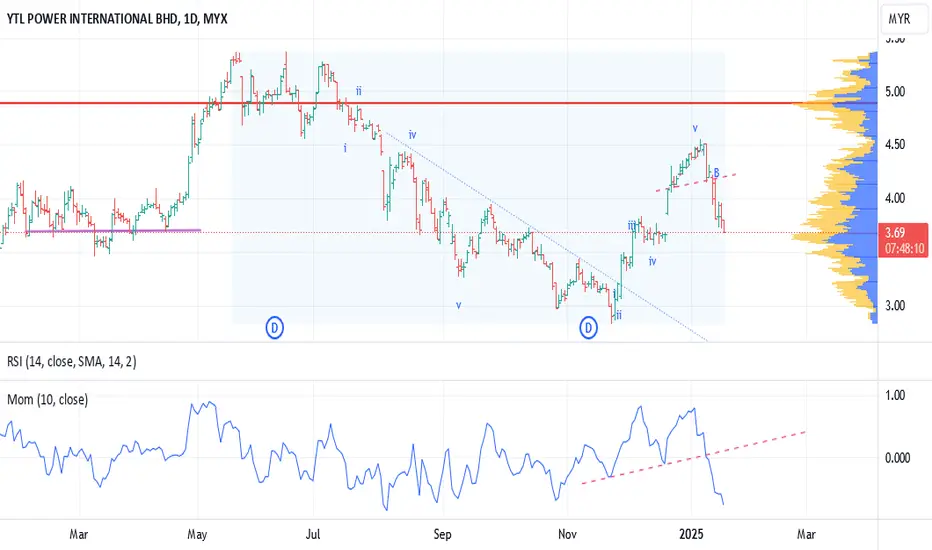
YTL Power finished its wave 5YTL Power completed its wave 5 and is in a correction mode. Its target seems to be covering the gap

Ytlpwr, pullback in making?YTLPWR is showing a strong bearish signal as the RSI, MACD, and even the Moving Averages (MA) lines have all formed a death cross. This pattern suggests a high probability of further downward movement. Investors should remain cautious and closely monitor the next price actions to navigate the potential volatility ahead.
The markets took a sharp dive today, with the red wiping out the gains painstakingly accumulated over the past week. Amid the turbulence, the winners were predominantly the big players — those with deep pockets and steady strategies.
For the smaller players, it’s a sobering reminder that the market is not a place for pity but a battleground where knowing the rules and playing wisely are the keys to survival. In this high-stakes game, every move counts, and resilience often separates those who thrive from those who merely survive.
Disclaimer: The mentioned stocks are based solely on personal opinions for educational and discussion purposes only. There are no buy or sell recommendations. Trading involves financial risk, and you are responsible for your own decisions. The author shall not be responsible for any losses or lost profits resulting from investment decisions based on the information contained herein.

YTLPOWR, why it so interesting?YTLPOWR is pretty interesting! Let's break it down:
Analysis
1. Price Movement: The stock recently dropped to 3.00 MYR from a high of 5.47 MYR. That's quite a dip!
2. MACD: It looks like the blue MACD line is below the orange signal line, indicating bearish momentum.
3. RSI: The RSI is hovering around the oversold region, suggesting the stock might be undervalued soon.
4. Annotations:
- MSS (Market Structure Shift) and BOS (Break of Structure) indicate significant changes in market behavior.
- FVG (Fair Value Gap) and VI (Volume Imbalance) could be key areas to watch for potential price reversals or continuations.
Divergences
No clear divergences are apparent in MACD or RSI at the moment.
Potential Movement
- Bullish Scenario: If it rebounds from 3.00 MYR, it could rally back towards resistance levels.
- Bearish Scenario: If it continues to drop, the next support might be around 2.50 MYR.
Overall, the indicators suggest it might be nearing a point of reversal or consolidation. Keep an eye out for any shifts in momentum! 📉📈
No trader/investor is right all the time. No strategy/method is 100% profitable. Cut your losses quickly, without hesitation.
Disclaimer: The mentioned stocks are based solely on personal opinions for educational and discussion purposes only. There are no buy or sell recommendations. Trading involves financial risk, and you are responsible for your own decisions. The author shall not be responsible for any losses or lost profits resulting from investment decisions based on the information contained herein.

YTLPOWR, resistance turn support?YTLPOWR appears to have recently seen a key resistance level turning into support?
This shift can often signal strength in the stock's momentum. However, should the stock move lower, waiting for a clearer opportunity to re-enter or accumulate might be a prudent approach.
The probability here leans on two outcomes: if the new support holds, we could see further upside potential. On the other hand, if the stock dips below this new support, it could signal a deeper pullback, and patience would be required to wait for more favorable levels or a new bullish setup.
As always, technical patterns provide guidance, but other factors such as market sentiment, news, or fundamentals should be considered as well.
Feel free to share your thoughts 🤔 💭
It's crucial to not only know the right time to buy but, more importantly, to be ready and willing to sell when the time comes!
Disclaimer: The mentioned stocks are based solely on personal opinions for educational and discussion purposes only. There are no buy or sell recommendations. Trading involves financial risk, and you are responsible for your own decisions. The author shall not be responsible for any losses or lost profits resulting from investment decisions based on the information contained herein.

YTLPOWR, the DC theme still on?The stock remains below the downtrend line, and the MACD is still in a bearish crossover.
While both the MACD and RSI are showing positive divergence, the strength of this signal remains uncertain. For a sustained move, the price needs to break out of the current downtrend; otherwise, it may just be suitable for a quick FIFO trade.
It's essential to seek at least three confirmations before making a move—anything less is simply gambling.
Disclaimer: The mentioned stocks are based solely on personal opinions for educational and discussion purposes only. There are no buy or sell recommendations. Trading involves financial risk, and you are responsible for your own decisions. The author shall not be responsible for any losses or lost profits resulting from investment decisions based on the information contained herein.

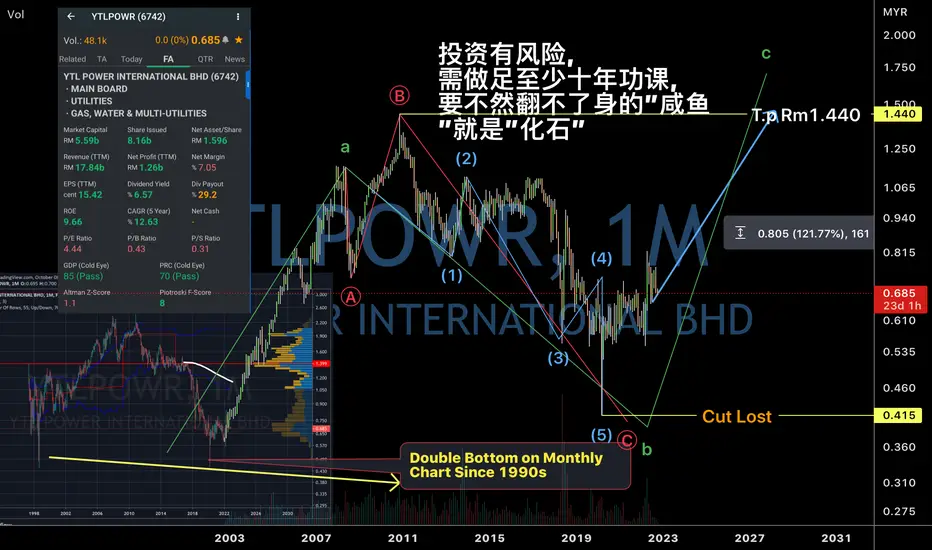
YTLPOWR how high it can go? 3/July/24YTLPOWER price probably just 1/6 (RM5.44) of its > RM30 price.. The A.I revolution will not only need more data centre but energy power as well than ever before.( PLUS more clean energy e.g solar power.) As the "sub contractor" of the main con ( Tenaga) , YTLPOWER will benefit a lot from...Long YTLPOWR on year 2025, if there is pullback toward 2.00 +/- which is a confluence zone of 1) Median line of pitchfork (thick blue trendline) 2) Monthly Order Block / Demand Zone

Alternative Pivots|Buy During Pull Back (Swing Trade)Entry: Tight multi-day period on the charts prior to the general base pivot
Exit: Near the Tight Area of the Consolidation, Risk 3-5 %

Time Cycle Analysis: YTLPowerTime Cycle Analysis: YTLPower NTA RM2.26 and the next key dates to watch are April 30 2024 and July 10 2024.

Time Cycle Analyais: YTL PowerTime Cycle Analysis: YTL Power above 3.2 is bullish, below 3.2 is bearish. The strong earning has been inflated by weakening ringgit so a stronger ringgit will erase some profit. April 8, 2024, total solar eclipse will cross North America, passing over Mexico, the United States, and Canada which according to Chinese Ancient Culture this day will associate with negative qi. Next key date to watch is 25 April 2024.

YTLPOWR breakout downward from the top. caution.YTLPOWR breakout downward from the top. caution. Reversal down is in the making.
#ARTTpick #KebayaTrader

YTL Power, Nvidia, Tesla momentum indicators"The Monday, April 8, 2024, total solar eclipse will cross North America, passing over Mexico, the United States, and Canada. The total solar eclipse will begin over the South Pacific Ocean. Weather permitting, the first location in continental North America that will experience totality is Mexico’s Pacific coast at around 11:07 a.m. PDT." (source: science.nasa.gov)
Chinese Myth of Solar Eclipses: In some ancient Chinese myths, a total solar eclipse was seen as a negative omen, potentially bringing misfortune. However, it's crucial to understand this as a cultural belief and not a scientifically proven phenomenon. A total solar eclipse will indeed occur on April 8, 2024, with its path traversing parts of North America. Scientifically, eclipses are natural astronomical events caused by the alignment of celestial bodies, and they have no inherent impact on human affairs or fortune.

YTLPOWR - how it go?>> broken those fast EMA lines, Hull MA red. Not a good sign for me.
>> Pink colour uptrend line as support. But it strong enough?
>> Stochastics down ATM. Just let it down.
>> Always protect downside. Play again when have opportunity.
When the market moves where, and how, and if - these are all unknown. The only thing which we can control is our risk. Focus on risk management!
Keep the long term vision.
Disclaimer: Mentioned stocks are solely based on own opinions for education and/or discussion purpose only. There's no buy and/or sell recommendation. Trading involve financial risk on your own. The author shall not be responsible for any losses or lost profits resulting from investment decisions based on the use of the information contained herein.

YTLPOWER, potential strength breakoutYTLPOWER is displaying signs of potential strength, with an upward trajectory that remains above the EMA50 breakout point. This indicates a possible continuation of the uptrend for the stock

Up Trend continuationYTL Power has made a power move today. By mid-day, a long candle has formed, driven by volume about the same size as the volume for the full day yesterday. It has been in range-bound trading in the past 9 weeks.
Signs are good for a strong bullish rally. How high will it go? Fib Retracement Ext has TP at 2.50

YTLPWR pending BO?Overall still overbought (OB).
Con:
> price below Hull MA.
Pro :
>> still support by EMA 7.
WHAT next?
>> Waiting retailers to buy in, price will up, let say 5% 🤔
>> Worst part is GG when operators sell all their tickets.
Let see how it go.
Disclaimer: Mentioned stocks are solely based on own opinions for education and/or discussion purpose only. There's no buy and/or sell recommendation. Trading involve financial risk on your own. The author shall not be responsible for any losses or lost profits resulting from investment decisions based on the use of the information contained herein.

YTL power (up)? and?..30/August/23YTL power have been surging up for more than 100% since last post on 8/Oct/22 @ 0.686 (before bonus split). No more slow and steady? or Zzzzz?

YTLPOWR, possible continuation?Looking at MYX:YTLPOWR for a continuation to the upside. Overall regional peers are lower however, might or might not trigger.
Trigger: RM1.10
STOP: RM1.06
Target: RM1.19
These are my views and analysis and is only used for educational purposes. I am not a financial advisor.
Nothing in the information posted here is intended to be or should be interpreted as trading advice.

YTLPOWER. Slow and steady? 8/Oct/22YTLPOWER. A energy’s related stock which give Average dividend of 6% for past few years. Price possible found its long term “base” with monthly hammer candlestick / pin bar pattern on major support a double bottom pattern
YTLPOWR 6742 Bursa MalaysiaThe study is based upon Volume Price Spread Analysis and Momentum
YTLPOWR has shown both Breakout and Momentum.
Close: 0.78
EP: 0.76 - 0.795
SL: 0.68
TP: 0.87/0.96
Disclaimer: This study does not constitutes Buy/Sell per say. Please consult your financial advisor before making any trading/investing decision

YTLPOWRFA - 1x QR profit can turn its fate?
TA - VCP is on it ways and ready to go... The most important is seem likes too many Buy volume in past 1 month 😁


YTLPOWR: Potential BuyBuy upon breakout above 0.68 with take profit target at 0.70, 0.725. Cutloss if fall below 0.66/0.645.
