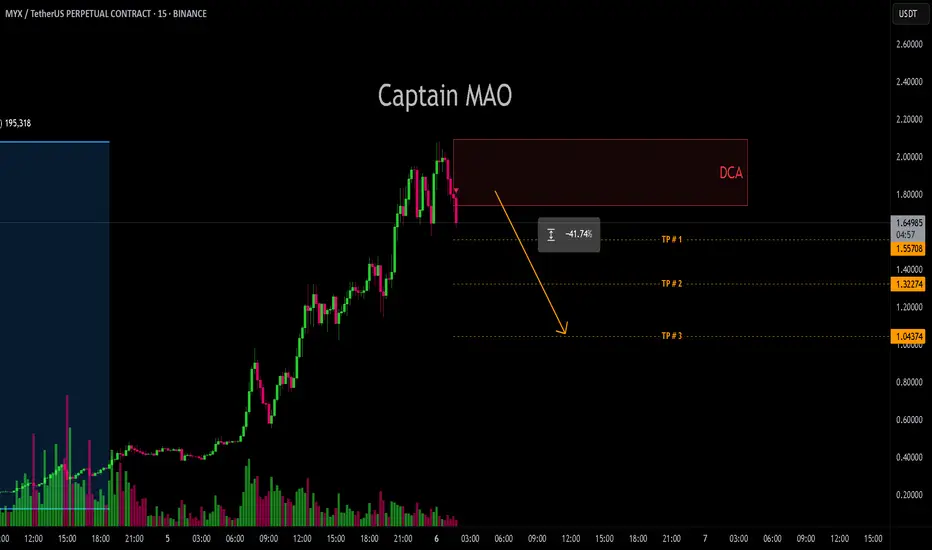
MYX/USDTThe past three days have been historic for MYX, with the token surging over +1500%, marking one of its most explosive moves to date. However, such parabolic rallies rarely sustain without a significant correction, and early signs of buyer exhaustion and weakness are emerging at the current zone.
With volume tapering off and momentum showing divergence, the setup favors a 40–50% correction to reset structure and allow for healthier continuation later
MYXUSDT.P trade ideas
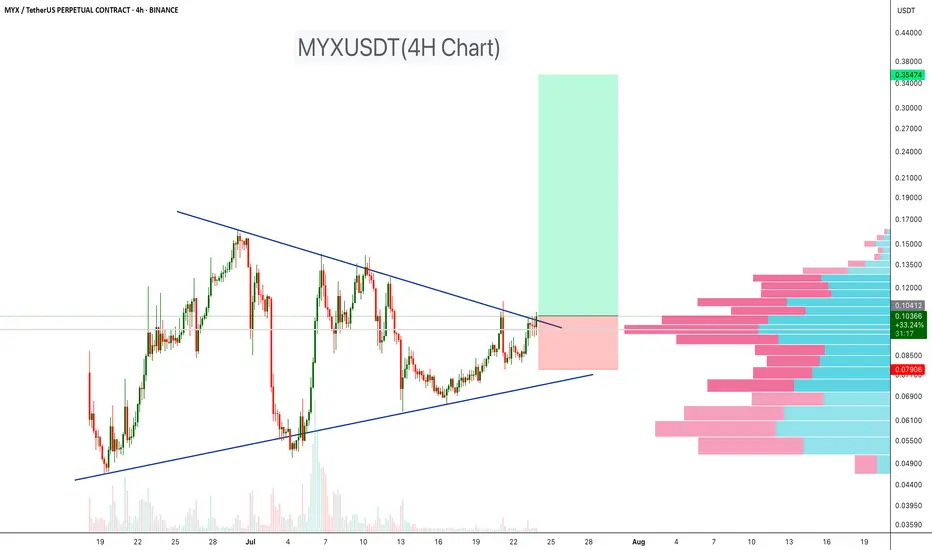
MYXUSDT Triangle Breakout!MYXUSDT is breaking out of a well-defined symmetrical triangle on the 4-hour timeframe, after weeks of consolidation between tightening trendlines. The breakout is occurring just above a high-volume node, as shown on the right-side volume profile, which now acts as a strong demand zone and potential support for continuation.
Price is currently holding above the breakout level ($0.105), with solid momentum and improving volume, indicating a potential trend expansion toward the projected target zone near $0.35.
Cheers
Hexa
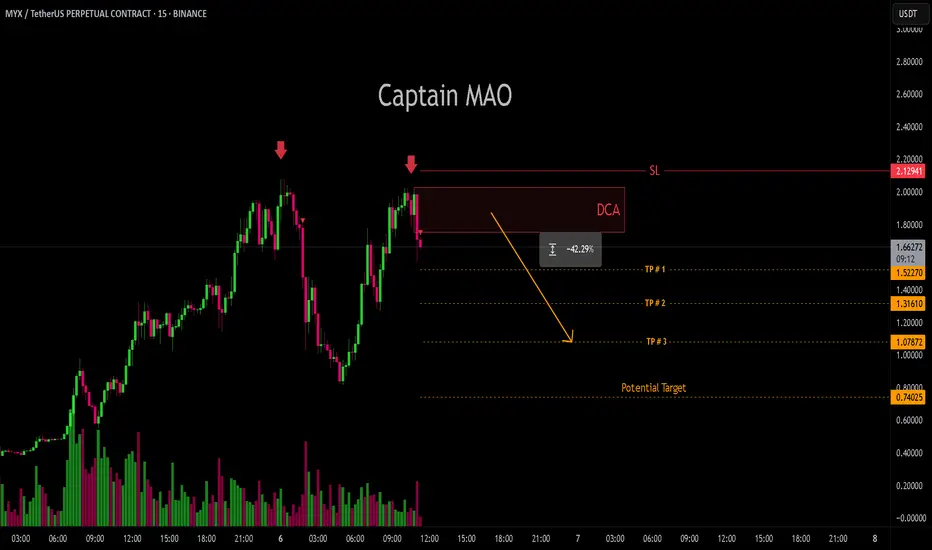
MYX/USDT - 2nd Round After our first short setup, MYX delivered a quick and clean 40% drop, validating the overextended structure. Now, price action has formed a clear double top pattern, signaling further weakness and potential trend reversal.
MYX is likely setting up for another sharp leg down. This next move could target 40–45% downside initially, with potential to extend toward a 60% correction from current levels.
MYX Forming Broadening Channel on 2H🕒 On the 2H timeframe, LSE:MYX is shaping up a broadening channel — volatility is expanding as the structure widens 📊.
⚠️ As a newly listed asset, MYX has limited historical price data, which increases the chance of false breakouts or unreliable patterns.
For now, it's best to observe how price behaves near the upper and lower bounds of the channel. A clean breakout or breakdown could set the tone, but caution is key due to low volume and incomplete structure.
👀 One to watch — patience is the play here.
Not financial advice.

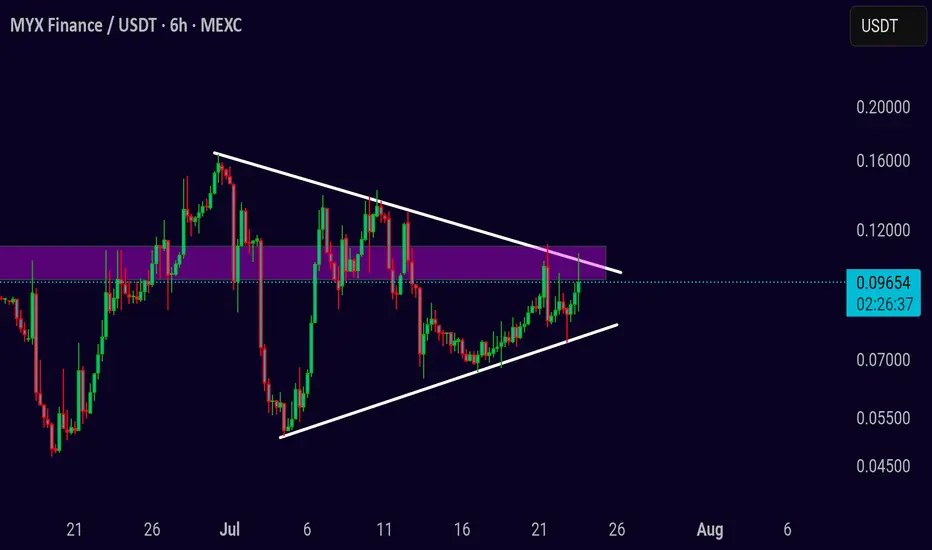
MYX/USDT Tightening Range – Big Move Loading
Pair: MYX/USDT
Timeframe: 6H
Structure: Symmetrical consolidation and breakout watch
MYX has been consolidating within a tightening structure, forming higher lows while repeatedly testing the descending resistance line. Price is now trading near the upper boundary and within a key supply zone, suggesting that a decisive move could be close.
Bullish case:
A confirmed breakout above 0.1100 with strong volume could trigger a continuation move to the upside. If that happens, the next targets to watch are 0.1400 and 0.1800. Look for a retest of the breakout level for a safer entry.
Bearish case:
If MYX fails to sustain above 0.1100 and breaks down below 0.0850, sellers may take control, with potential downside targets around 0.0750 and 0.0650.
Price is approaching a decision point. Monitor volume closely and wait for a clean breakout confirmation before entering a position. Set alerts and stay prepared for either direction.
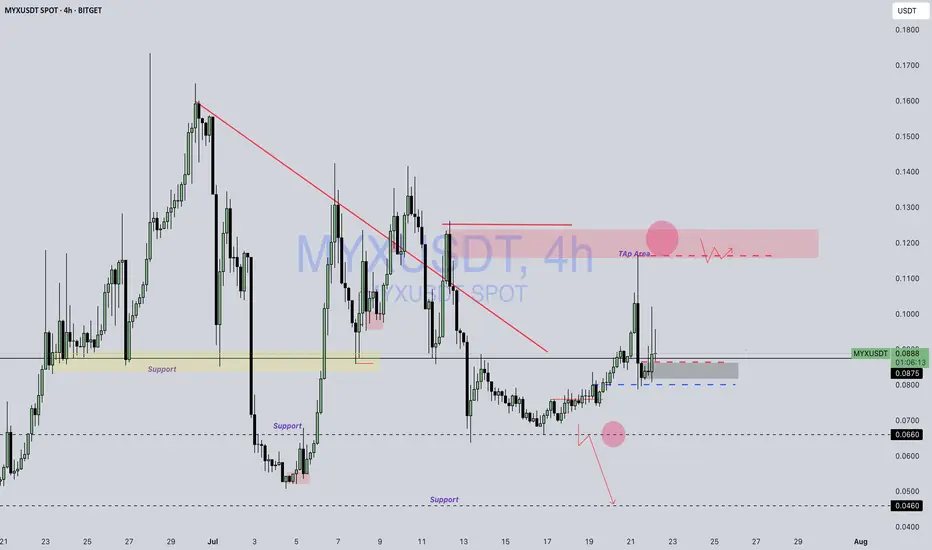
MYX / Usdt BITGET:MYXUSDT
🚨 **MYX Coin Alert**
Watch closely — we're nearing the **target zone**.
📍 **Tap area** is in sight, and momentum is building!
Stay sharp. 🔥💹
⚠️ **Disclaimer:**
*This is not financial advice. The content is for educational and informational purposes only. Always do your own research and manage risk accordingly.*
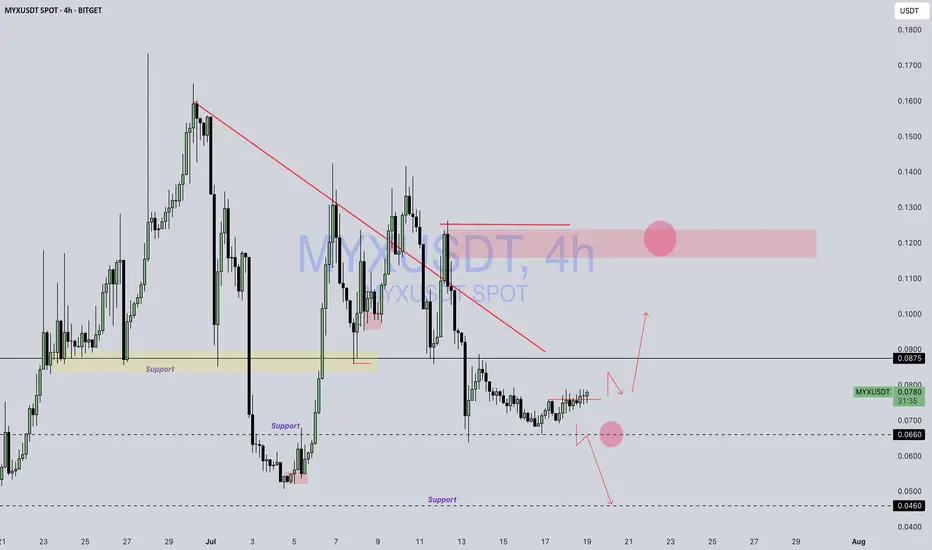
MYX / USDTBITGET:MYXUSDT
Something’s cooking in MYX… 🍳📊
Be careful now — and enjoy it later.
The chart’s heating up — don’t sleep on it. 🔥👀
Disclaimer : Not Financial Advice
Bullish Short term setupJust losing trader trying to recover sharing a hopefully winning trade :)
Already in the long trade SL and TP as the chart

MYX / USDTBITGET:MYXUSDT
### ⚠️ MYXUSDT Technical Overview – 3H Chart
---
### 📍 **Price at Analysis:** \~0.1004 USDT
🔻 -3.35% on the current 3-hour candle
---
### 🔼 **Resistance Zones:**
1. **0.128 – 0.145 USDT (Red Zone):**
* Price was sharply rejected here twice.
* Aligns with **downtrend resistance line**.
* Strong sell pressure.
2. **Trendline Resistance (Red Diagonal):**
* Bearish structure still intact.
* Lower highs forming consistently.
* Price must break this trendline + red zone for a reversal confirmation.
---
### 🔽 **Support Zones:**
1. **0.0875 USDT**
* Labeled “Not clear Support” — suggests minor or uncertain buying interest.
* Still acting as a reaction level.
2. **0.0700 – 0.0660 USDT (Yellow Zone):**
* Valid historical support, reacted strongly before.
* Possible bounce area if price breaks below 0.0875.
3. **0.0460 USDT (Blue Line):**
* Strong, deeper support.
* Acts as a **last-stand** zone before major drop continuation.
---
### 🔍 **Chart Summary (Human Tone):**
MYXUSDT is clearly in a **downtrend**, facing strong selling near the red zone. The recent bounce lost momentum right at the trendline. Unless bulls break above 0.13 with volume, risk remains high. Support near 0.0875 is weak, so if price fails there, **downside toward 0.0660 or lower** is possible.
---
> **Disclaimer:** *This is not financial advice. Chart analysis is for educational and informational purposes only. DYOR (Do Your Own Research).*

MYX/USDT GOD candle 0.25-0.27$showing strong momentum and breakout structure. Price action suggests a potential God candle incoming with high volume support. Expecting a sharp move targeting the $0.25 – $0.27 zone.
Entry: Current market price or on minor dips
Targets:
TP1: $0.25
TP2: $0.27
