AAXJ Long 11/30/23NASDAQ:AAXJ
The break of the wave iv of (c) of ((ii)) high at 64.86 indicates the likely completion of a zig-zag correction in AAXJ. The pattern displays a perfect corrective channel and ideal Fibonacci proportions. Downside should remain corrective against the wave ((ii)) low of 60.92 as price
Key stats
About iShares MSCI All Country Asia ex Japan ETF
Home page
Inception date
Aug 13, 2008
Structure
Open-Ended Fund
Replication method
Physical
Dividend treatment
Distributes
Distribution tax treatment
Qualified dividends
Income tax type
Capital Gains
Max ST capital gains rate
39.60%
Max LT capital gains rate
20.00%
Primary advisor
BlackRock Fund Advisors
Distributor
BlackRock Investments LLC
AAXJ selects its holdings from a nearly identical universe to our segment benchmark. It does diverge a bit by limiting its universe to the top 85% of companies by market cap, so it does tilt to large- and mid-caps. The fund primarily invests in Asian countries from both developed and emerging markets excluding Japan. The index is rebalanced semi-annually each May and November.
Related funds
Classification
What's in the fund
Exposure type
Electronic Technology
Finance
Technology Services
Stock breakdown by region
Top 10 holdings

iShares MSCI All Country Asia ex Japan ETF, here's a technical aPrice Action:
The price is currently in an uptrend, having recently bounced off support around the $68-69 level. There's a clear "Buy Points Zone" marked on the chart between approximately $69.56 and $70.09, suggesting a potential accumulation area.
Support and Resistance:
- Strong support: $68.83

Asia on the riseChannel breakout. 5 waves impulsive move to the upside.
we might see pullback to the grey box to complete wave (2)

Bullish Divergence for EEMA and AAXJI predict EEMA or MSCI Emerging Markets Asia and AAXJ or MSCI Asia ex Japan are Bottoming.
There are Bullish Divergence between the ETFs and RSI 14.
This means that stock market in Asia is ending the Downtrend and starting to Uptrend.

Aaxj overbought again. Expect a retest of support Filled the gap and technically overbought. Expect this to retest Support

Update on AAXJAAXJ broke the trend line. 70.11-68.83 is the next horizontal support range. Not touching this until it holds a support. Wouldn't be surprised if it drops all the way down to long term diagonal support

Update on AAXJI sold out of AAXJ at 76 when it failed at my price target. I will reenter on weakness. Right now it looks overbought to me

Update on AaxjMy price target has been met. Let’s see if it holds. If we break this resistance line the next horizontal line of resistance is around 76.88

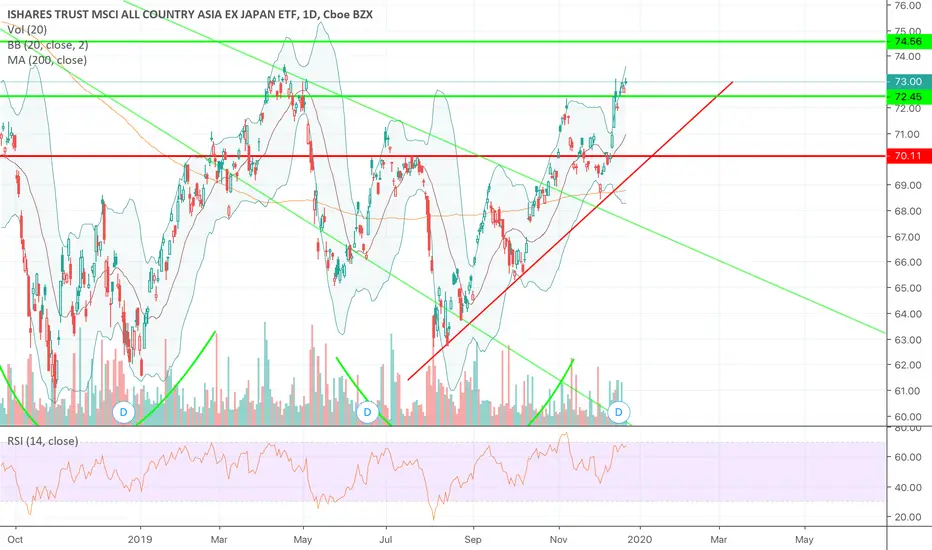
AAXJ key levels $AAXJ has held support at 70.11. If it breaks resistance and holds at 72.45 next major resistance range is 74.55. Looks like a double bottom has formed as downtrend resistance has been broken

See all ideas
Summarizing what the indicators are suggesting.
Oscillators
Neutral
SellBuy
Strong sellStrong buy
Strong sellSellNeutralBuyStrong buy
Oscillators
Neutral
SellBuy
Strong sellStrong buy
Strong sellSellNeutralBuyStrong buy
Summary
Neutral
SellBuy
Strong sellStrong buy
Strong sellSellNeutralBuyStrong buy
Summary
Neutral
SellBuy
Strong sellStrong buy
Strong sellSellNeutralBuyStrong buy
Summary
Neutral
SellBuy
Strong sellStrong buy
Strong sellSellNeutralBuyStrong buy
Moving Averages
Neutral
SellBuy
Strong sellStrong buy
Strong sellSellNeutralBuyStrong buy
Moving Averages
Neutral
SellBuy
Strong sellStrong buy
Strong sellSellNeutralBuyStrong buy
Displays a symbol's price movements over previous years to identify recurring trends.
Frequently Asked Questions
An exchange-traded fund (ETF) is a collection of assets (stocks, bonds, commodities, etc.) that track an underlying index and can be bought on an exchange like individual stocks.
AAXJ trades at 85.48 USD today, its price has fallen −0.27% in the past 24 hours. Track more dynamics on AAXJ price chart.
AAXJ net asset value is 85.45 today — it's risen 3.16% over the past month. NAV represents the total value of the fund's assets less liabilities and serves as a gauge of the fund's performance.
AAXJ assets under management is 2.84 B USD. AUM is an important metric as it reflects the fund's size and can serve as a gauge of how successful the fund is in attracting investors, which, in its turn, can influence decision-making.
AAXJ price has risen by 3.70% over the last month, and its yearly performance shows a 21.52% increase. See more dynamics on AAXJ price chart.
NAV returns, another gauge of an ETF dynamics, have risen by 3.16% over the last month, showed a 17.48% increase in three-month performance and has increased by 22.87% in a year.
NAV returns, another gauge of an ETF dynamics, have risen by 3.16% over the last month, showed a 17.48% increase in three-month performance and has increased by 22.87% in a year.
AAXJ fund flows account for −23.10 M USD (1 year). Many traders use this metric to get insight into investors' sentiment and evaluate whether it's time to buy or sell the fund.
Since ETFs work like an individual stock, they can be bought and sold on exchanges (e.g. NASDAQ, NYSE, EURONEXT). As it happens with stocks, you need to select a brokerage to access trading. Explore our list of available brokers to find the one to help execute your strategies. Don't forget to do your research before getting to trading. Explore ETFs metrics in our ETF screener to find a reliable opportunity.
AAXJ invests in stocks. See more details in our Analysis section.
AAXJ expense ratio is 0.72%. It's an important metric for helping traders understand the fund's operating costs relative to assets and how expensive it would be to hold the fund.
No, AAXJ isn't leveraged, meaning it doesn't use borrowings or financial derivatives to magnify the performance of the underlying assets or index it follows.
In some ways, ETFs are safe investments, but in a broader sense, they're not safer than any other asset, so it's crucial to analyze a fund before investing. But if your research gives a vague answer, you can always refer to technical analysis.
Today, AAXJ technical analysis shows the buy rating and its 1-week rating is buy. Since market conditions are prone to changes, it's worth looking a bit further into the future — according to the 1-month rating AAXJ shows the buy signal. See more of AAXJ technicals for a more comprehensive analysis.
Today, AAXJ technical analysis shows the buy rating and its 1-week rating is buy. Since market conditions are prone to changes, it's worth looking a bit further into the future — according to the 1-month rating AAXJ shows the buy signal. See more of AAXJ technicals for a more comprehensive analysis.
Yes, AAXJ pays dividends to its holders with the dividend yield of 1.14%.
AAXJ trades at a premium (0.04%).
Premium/discount to NAV expresses the difference between the ETF’s price and its NAV value. A positive percentage indicates a premium, meaning the ETF trades at a higher price than the calculated NAV. Conversely, a negative percentage indicates a discount, suggesting the ETF trades at a lower price than NAV.
Premium/discount to NAV expresses the difference between the ETF’s price and its NAV value. A positive percentage indicates a premium, meaning the ETF trades at a higher price than the calculated NAV. Conversely, a negative percentage indicates a discount, suggesting the ETF trades at a lower price than NAV.
AAXJ shares are issued by BlackRock, Inc.
AAXJ follows the MSCI AC Asia ex JP. ETFs usually track some benchmark seeking to replicate its performance and guide asset selection and objectives.
The fund started trading on Aug 13, 2008.
The fund's management style is passive, meaning it's aiming to replicate the performance of the underlying index by holding assets in the same proportions as the index. The goal is to match the index's returns.