YETI | Long | Seasonal & Technical Setup | (June 30, 2025)YETI | Long | Seasonal & Technical Setup | (June 30, 2025)
1️⃣ Insight Summary:
YETI is preparing for a potential breakout if it can reclaim key resistance levels, supported by summer seasonality and brand strength.
2️⃣ Trade Parameters:
Bias: Long (only if condition is met)
Entry: $41.00 (needs to break and hold above this level to confirm strength)
Stop Loss: $39.00 (below recent structure)
TP1: $48.00
TP2: $51.00
TP3: $54.00
Final Target: $59.67
3️⃣ Key Notes:
✅ Strong seasonality from June to September, usually driven by outdoor activities and summer sales.
✅ Financially, YETI remains solid with revenue around $1.83 billion and net income ~$175 million.
✅ The company is heavily U.S.-focused and most revenue comes from drinkware and coolers.
✅ Entry condition: I will only enter if price clearly breaks and sustains above $41. If this doesn’t happen, I stay out.
❌ Risks include margin compression and weaker consumer spending.
4️⃣ Follow-up Note:
Will actively monitor price action above $41 and update if conditions change.
ACIW | Watchlist | Software & Fintech Growth Setup | (June 30, 2025)
1️⃣ Insight Summary:
ACIW (ACI Worldwide) is showing healthy fundamental improvements but remains in a sideways technical structure. Worth watching for a potential setup later this year.
2️⃣ Key Notes:
✅ ACIW focuses on software for real-time electronic payments, working with banks, merchants, billers, and government sectors.
✅ Financials look solid: Debt has decreased from ~$1.23 billion to ~$970 million over four years, and cash flow remains healthy.
✅ Revenue growth outlook is strong, with expectations for steady gains in upcoming years.
✅ Seasonal pattern: Often shows sideways movement, but tends to rally in November — making it a possible watchlist candidate for later in the year.
❌ For now, no immediate entry. Will only consider if specific conditions are met (e.g., strong technical breakout or confirmed momentum).
3️⃣ Follow-up Note:
Staying on watchlist until setup aligns; no rush to enter without a clear confirmation.
Please LIKE 👍, FOLLOW ✅, SHARE 🙌 and COMMENT ✍ if you enjoy this idea! Also share your ideas and charts in the comments section below! This is best way to keep it relevant, support us, keep the content here free and allow the idea to reach as many people as possible.
Disclaimer: This is not financial advice. Always conduct your own research. This content may include enhancements made using AI.
ACIW trade ideas

ACIW – Long Trade Setup!📈 🟢
Ticker: ACI Worldwide, Inc. (NASDAQ: ACIW)
Chart: 30-Min Timeframe
Pattern: Symmetrical triangle breakout
🔹 Entry: $52.38 (breakout + reclaim level)
🔹 Stop-Loss: $51.92 (below wedge + structure)
🔹 Take Profits:
TP1: $52.96 – Recent resistance
TP2: $53.66 – Breakout target zone
⚖️ Risk-Reward Calculation
– Risk per Share: $0.46
– Reward to TP2: $1.28
– R:R Ratio: ~1:2.7 ✅
🧠 Technical Highlights
– Clean breakout from tight triangle
– Volume building near breakout point
– Support trendline holding with higher lows
– Bullish structure forming since April 22

ACIW (ACI Worldwide) – 30-Min Short Trade Setup !📉🚀
🔹 Asset: ACI Worldwide (ACIW)
🔹 Timeframe: 30-Min Chart
🔹 Setup Type: Bearish Breakdown Trade
📌 Trade Plan (Short Position)
✅ Entry Zone: Below $51.72 (Breakdown Confirmation)
✅ Stop-Loss (SL): Above $53.09 (Invalidation Level)
🎯 Take Profit Targets:
📌 TP1: $50.46 (First Support Level)
📌 TP2: $49.10 (Extended Bearish Move)
📊 Risk-Reward Ratio Calculation
📉 Risk (SL Distance): $53.09 - $51.72 = $1.37 risk per unit
📈 Reward to TP1: $51.72 - $50.46 = $1.26 (1:0.92 R/R)
📈 Reward to TP2: $51.72 - $49.10 = $2.62 (1:1.91 R/R)
💡 Good Risk-Reward Setup – Aiming for a 1:1.91 R/R at TP2.
🔍 Technical Analysis & Strategy
📌 Bearish Descending Trendline Rejection – Price was rejected at the descending trendline.
📌 Weak Buying Pressure – Struggling to break out above resistance.
📌 Volume Confirmation Needed – A strong selling volume below $51.72 will confirm the short setup.
📌 Momentum Shift Expected – Breakdown below $51.72 can push price to $50.46, then $49.10.
📊 Key Resistance & Support Levels
🔴 $53.09 – Stop-Loss / Resistance Level
🟡 $51.72 – Breakdown Level / Short Entry
⚪ $50.46 – First Target / TP1
🟢 $49.10 – Final Target / TP2
📉 Trade Execution & Risk Management
📊 Volume Confirmation – Ensure strong selling pressure below $51.72 before entering.
📉 Trailing Stop Strategy – Move SL to breakeven ($51.72) after hitting TP1 ($50.46).
💰 Partial Profit Booking Strategy:
✔ Take 50% profits at $50.46, let the rest run to $49.10.
✔ Adjust SL to breakeven ($51.72) after TP1 is hit.
⚠️ Fake Breakdown Risk:
❌ If price moves back above $51.72, exit early to limit losses.
❌ Wait for a strong bearish candle close before entering aggressively.
🚀 Final Thoughts
✔ Bearish Setup – Breakdown signals downside potential.
✔ Momentum Shift Possible – Watch for volume confirmation.
✔ Favorable Risk-Reward Ratio – 1:1.91 R/R to TP2.
💡 Stick to the plan, manage risk, and trade smart! 📉🔥
🔗 Hashtags for Engagement:
#ACIW 📉 #StockTrading 📊 #TradingNews 📉 #MarketUpdate 🔥 #Investing 💰 #ShortTrade 📉 #Stocks 📈 #ProfittoPath 🏆 #SwingTrading 🔄 #DayTrading ⚡ #TechnicalAnalysis 📉 #StockSignals 📊 #FinancialFreedom 💡 #MarketTrends 📊 #StockAlerts 🔔 #TradeSmart 🤓 #Bearish 📉 #RiskManagement ⚠️ #TradingCommunity 🤝 #SmartTrading 💰 #MarketAnalysis 📊 #TrendBreakdown 🚀

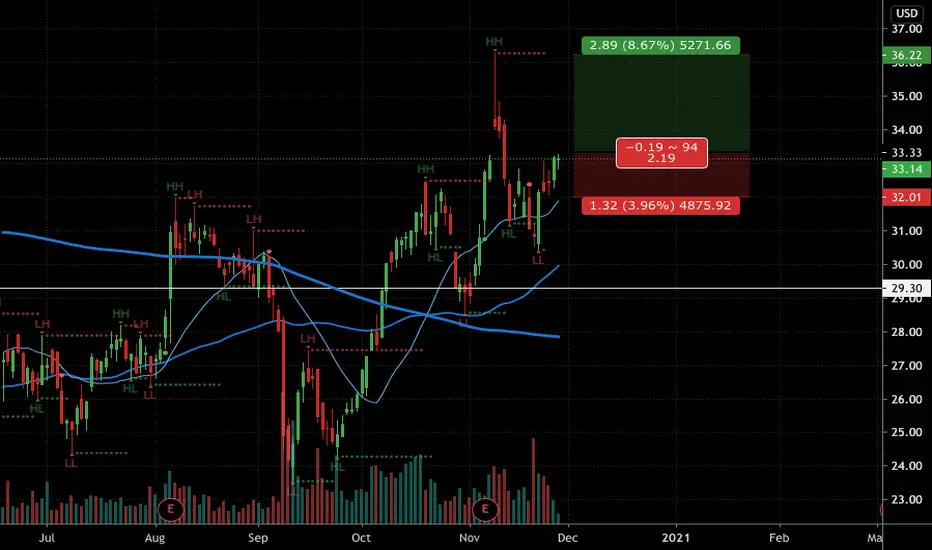
Watchlist: ACIWACIW, which recently had high volume (5) has a setup signal (1). I'm looking to enter long near the close of the day if the stock can manage to CLOSE above the last candle highs(2). If triggered, I will then place a stop-loss below (3) and a price target above it (4).

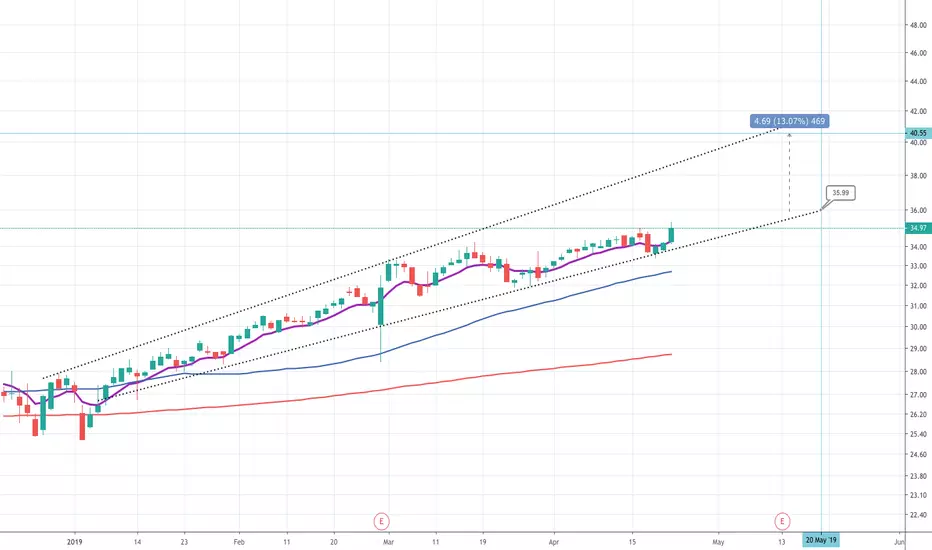
ACIW - Aug 24 MATrend Sustainable MomentumPotential good Risk and Reward at 2.92R, 1.25Fib is also above the resistance point. D1 is overall bullish and consolidating
MATrend Sustainable Momentum (Systematic) 🚀
This is a variant of the Unsustainable strategy. System identifies stocks (Tech sector) that follows the larger market regime's momentum of the day.

ACIW - Strong Horizontal SupportA strong horizontal support has appeared within an up channel
This horizontal should remain and the channel should continue, as continuation is most likely.
If a breakdown occurs look for the channel to break before anything matters.

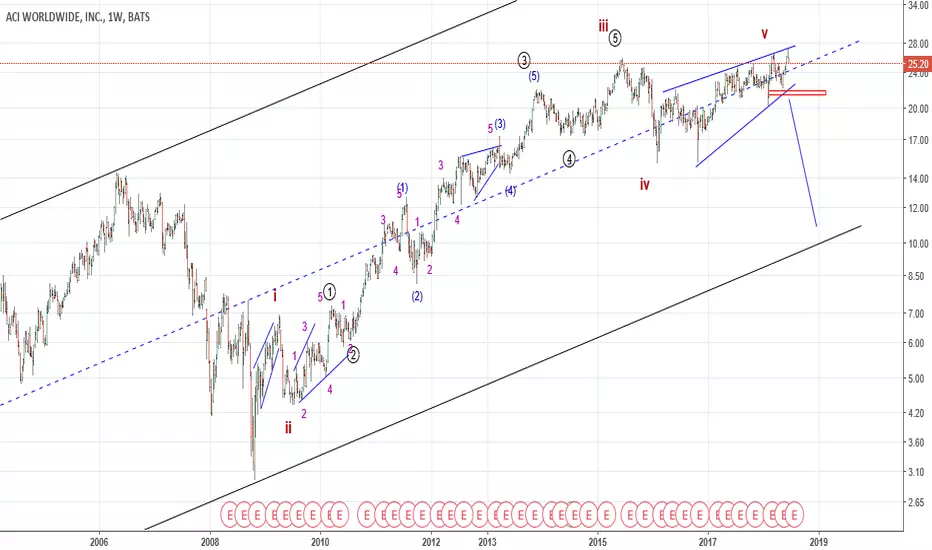
ACIW - Middle Trendline IdeaSome chart pattern can be Identified on chart, both wedges.
An uptrend can be drawn through the larger wedge
Allowing a support point to be found if price breaks down to 0.618 fib level (as indicated by bars pattern)

ACIW rebond ?right on the support at 30, let's see if this holds ! should break above in direction of 40
Risk is the short level - not sure how this is by now, if anybody can help ? thanks !

ACI Worldwide bearish divergence. Too much risk to open a long position on ACI. Short positions are more encouraging :)

ACI WORLDWIDE Course DailyHey my friends, ACI WORLDWIDE is in a bullish push with large buy volume issued and hammer bull bouigie. TIMEFRAME M1 shows bullish continuity, so there is a good chance of hitting the last precedent above (See TIMEFRAME H4). But for the moment not enough buying push between strong resistance to pass. So it may have a fallback on the symbolic level of 32.00.
Please LIKE & FOLLOW, thank you!

Conductor, Leading Brazilian Card Processor, Enters Latin AmericACIW: ACI Worldwide, Inc.
2020-06-01 08:00:00
Conductor, Leading Brazilian Card Processor, Enters Latin America Acquiring Market with ACI’s Cloud-Enabled Solutions Powered by Microsoft Azure


ACIWI have kept this stock for a few months now based on the huge double bottom pattern shown on the chart. The last monthly candle as February is about to end is bullish and right on the DB support line with a very long bottom tail. I also can see this candle tail has touched the long term trailing support band. All these signals point to a "keep this stock" message for the long term.

ACIW Bullish ReversalNASDAQ:ACIW Inverse head and shoulder pattern that's been forming the past 7 months. It just broke the neckline and from 2/22 - present it has seen support at the neckline. dmi has been below 25 for 3 months and 11 days and the best trends begin after periods where dmi crosses back and forth under 25 for a significant period of time so a break over 25 could be important. 5 day ema crossed through 15 ten days ago and they're diverging. Its in a consolidation thats price range is the same as another consolidation from 4/23/14 - 2/13/15, the older consolidation broke out into an uptrend. What I don't like is RSI is 64, rvi (relative volatility index) is 70, and the short ratio is 7.78. These are signs that it may be overbought but i think thats fair considering the past 7 months when its reached prices like this its gone down. If it does breakout im estimating resistance around the 22.50, that estimate comes from the depth of the head projected over the neckline.
