ADBE to follow Chyper and rebound to break flagif cypher pattern created, candles will reverse at D point and searching to break flag to continue bullish
ADBE trade ideas

ADBE - 2 way this could play outWe have 2 possiblities here.
Either we are in a complex WXY correction which would then take price towards 415 i n a corrective fashion similar to the dotted line drawing.
or
we are finishing a Flat corrective wave 2 pattern in which case price should remain above the invalidation level at 439 .
The usual termination point for wave (C) of a Flat pattern is the 100% and 127.2% projection of wave (A) from (B) but the 127.2% level would be below the invalidation level, therefore we can discard it for this setup.
100% level comes at 451, which is also the 78.6% retracement level of wave 1, known also as the last line of defense for bulls.
So, price needs to ideally remain above that level if we are to see higher prices.
Note also that any move above 505 even before touching the 451 level should be considered as a big bullish indication!

$ADBE | Adobe Inc. [Update] Bullish WedgeA bullish wedge formed after breaking out of the larger channel.
Watch for a breakout.
Good luck


Bullish Flag $ADBEAlmost the same analysis as $SOLO but different sector and industry.
Bullish flag on ADBE. Already had the volume spike on daily and also had the WMA crossover on hourly. Short put verticals at strikes 470/460 for 01/08 expiry

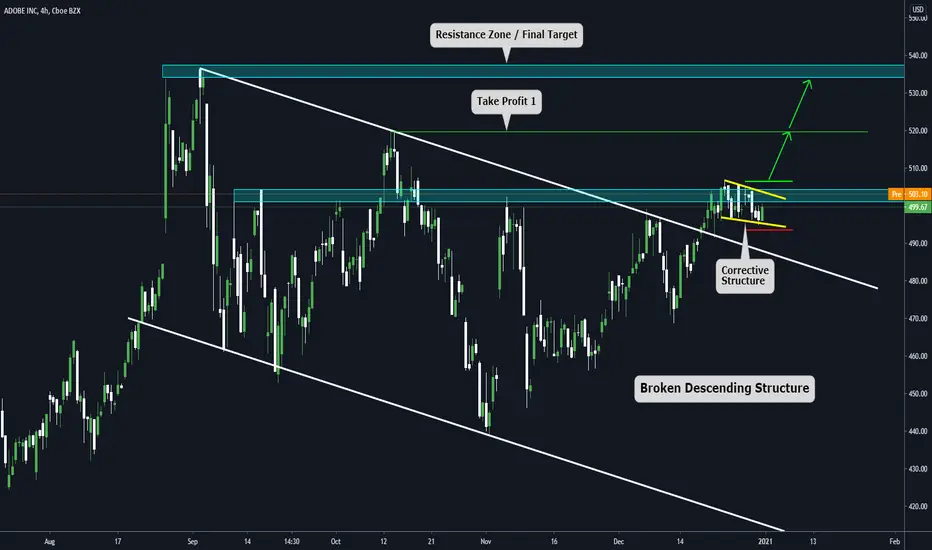
Short term opportunity on ADBE Today, we will show a bullish setup we have seen on ADBE.
a) The price has broken a major Descending structure
b) Now it's above a resistance zone
c) We can see a corrective structure on the mentioned resistance zone
d) If we have a breakout on the Green line, we will consider the analysis active / The same scenario for the red line (Invalidation of the analysis)
e) The TP1 area can be used to close the setup or move the stop loss to break-even (that is what we will do)
f) We are aiming for a final target at 533.10
g) This setup can provide a Risk Reward Ratio above 2
h) We expect a resolution between 10 to 20 days

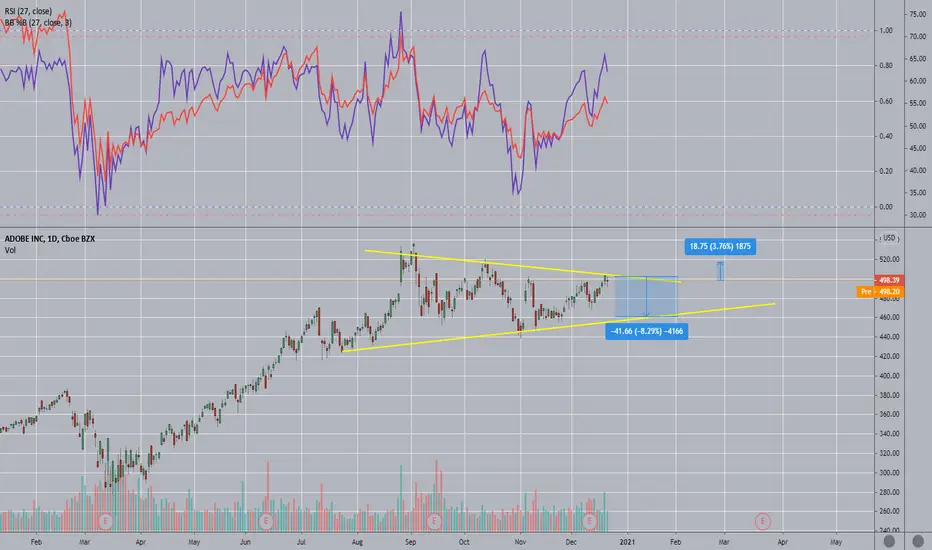
ADBE daily analysisHi friends
the daily chart of this market shows with a high probability that the first goal will be the level of 501.88.and if there will be a breakout at this level the second goal will be the level 542.88

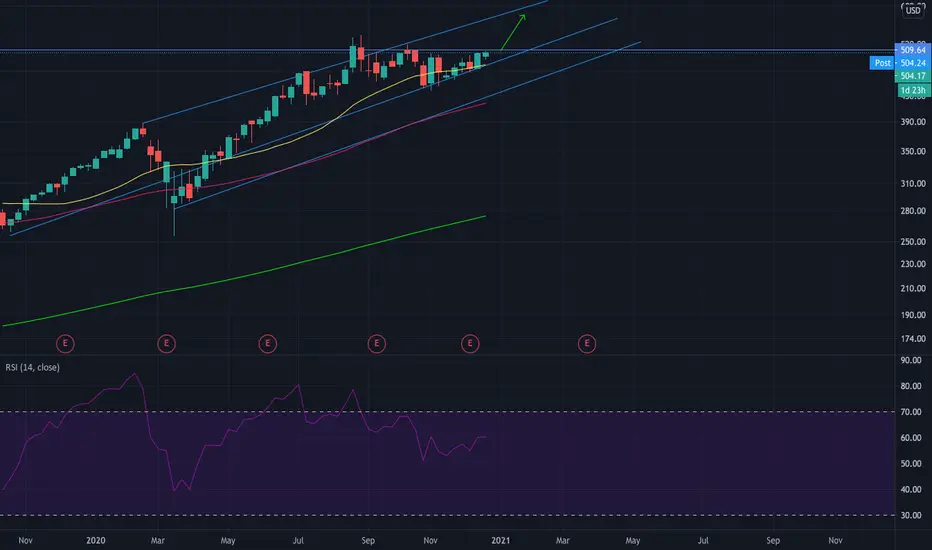
ADBELONG-TERM: Channel/Ascending Triangle breakout with 4hr hidden bullish divergence. Target is measured move of the ascending triangle but profit-taking is subjective here. (Not financial advice and moves slowly)

Showing strengthHas been strong all week, if it does come down would like to buy calls off the 20sma or retest. If not then will be watching for a break over last week's high.


ADBE buy zoneI am a casual trader while managing own online business.
I earn the side-income from options to pay bills, put food on table and even funding my annual travel =D
If you’re wish to do the same, consider to follow me here as I give detailed analysis on TradingView.
All my ideas are for my own opinion. There is a high-degree of risks involving leverage trading. Trade at your own risk. This is not financial advice.
If this chart help you to earn some penny. Appreciate if you want to donate me. TQVM 🙏

ADBE triangle break out at critical resistance levelsExpect ADBE to break ATH in 20 - 45 days time, entry point my varies, sizing for long swing, beside TA ADBE is a good fundamental stock to own since it dominates its own market for professionals.
Take the opportunity when Sell the news event happens on 21/12/2020.
Next target 1.272 level.

ADOBE INCADOBE INC
We must damage a very strong and large fraction to enter into a deal A strong and large purchase or a large green candle at which you are These are our signal as we would say that the size of buyers is very poor This must be the godless sacrifice without haste and thanks


big breakout incomingi might grab some shares or calls over 510 and target 540-550, id put my mental stop loss under 499.9. goodluck <3
Descending channel and Cup and Handle - Lets see if breaks outupside points of 20 and 35 based on Cup and Handle on breakout from the point of breakout
75 on channel
All it needs is a convincing breakout!

$adbe short short opportunityshort here or at 499.11 take profit at 463.7 and stop loss 515.77; 8% profit 3.5% risk
$ADBE - break out from triangle - 550-560 by next earningsThe stock is currently giving very good opportunity for long entry.
Analyst estimates: 550-560
Strong fundamentals
I'm in overweight and will stay for long with ADBE as I believe in this company's strategy.


Bullish breakBeauty volume on B/O of trend. Low vol nodes from here on up. Like this to go on a multi week run.

