ADBE trade ideas


5.25.2017 Trade Idea: ADBEIf you are interested in more of our trades, check out our profile and Tradingview Indicator @ChaoticTrader

Adobe Trend Reversal or Buy Opportunity?
Adobe (ADBE) exploded upwards on Friday, March 16th after reporting their earnings. At the same time, a huge reversal bar formed on the daily chart with the close at $126.94. The following trading day’s bar closed just below the low confirming a possible reversal of a pretty massive uptrend the stock has been under over the last months. Not to mention, Adobe and Microsoft (MSFT) have announced a joint venture in customer engagement and marketing, as well as an Adobe announcements of new cloud services. The cloud services could become a new commercial source of revenue, especially with Adobe’s niche in the creative marketplace as opposed to cloud service providers like Amazon’s (AMZN) AWS.
But is it time to go short and sell? Well, for now, yes, or with less capital risk, fade the reversal. Fundamentals for the company are strong, with growth showing in the long term. But our strategy is a swing strategy to take advantage of lower risk opportunities. This trade with a stop loss above the high of the reversal bar at $130.30 is definitely not the lowest risk of them all, but a credit spread might suffice before a high potential for bullish continuation in the long run.
If you’re an options player like myself or a straight underlying trader, then here’s a few sets of trades depending on your investment style.
1) Short the stock
Entry: any price today
Stop: $130.31 on market close
Trail it after two more days of closing bars until breakeven. If the trend has started in the downward direction, trail it to our middle moving average and follow it until the bulls take over
2) Credit Spread
Sell X Call, 21 Apr 17 Exp, 130 Strike
Buy X Call, 21 Apr 17 Exp, 135 Strike
Max Profit: ~13% Return on Risk/Investment
3) Stay on the sidelines, and wait for a buy signal fractal for medium/longer term trade
Buy X Amount of Calls, 20 Oct 17 Exp, 115 Strike
Again, from a technical standpoint, we currently rate Adobe (ADBE) a Sell in the short term, but the bullish uptrend has a high likelihood of continuing in the medium to longer term due to the fundamental outlook and growth opportunities for the company.
Until our next article.


ADBEAdobe is making a new high breaking a previous congestion zone. A new signal for going long again.

ADBEI just sold ADBE with a 20% gain. I will wait for the price to move to $113 to buy or if it breaks above $121.

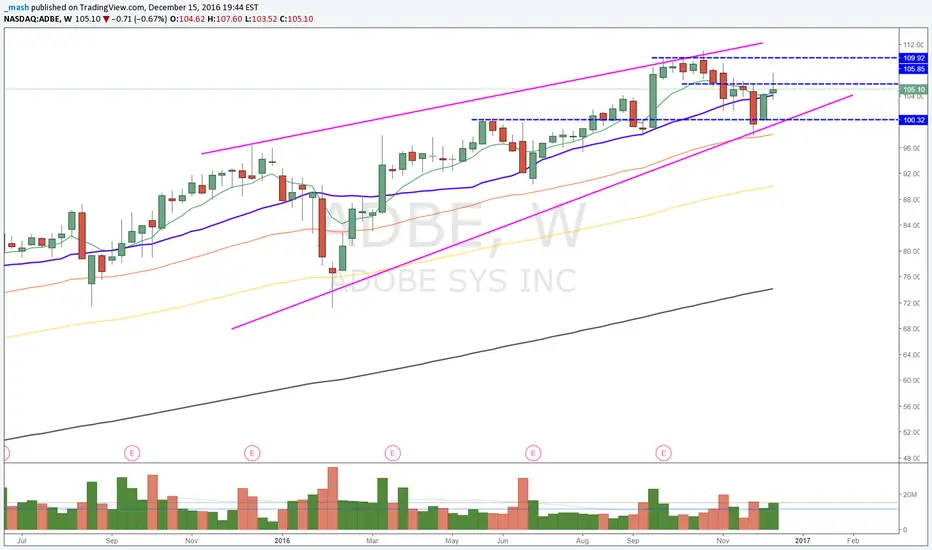
ADBE CLOSED ABOVE THE RESISTANCE TREND LINE
MACD, AND RSI ON THE WEEKLY STILL LOOKING GOOD... SHOULD SEE 120 SOON!

Buyout of Soul And Vibe, Inc (SOUL)There are rumors among major shareholders that Soul And Vibe (SOUL) is interested in selling. I think a deal may already be in the works.

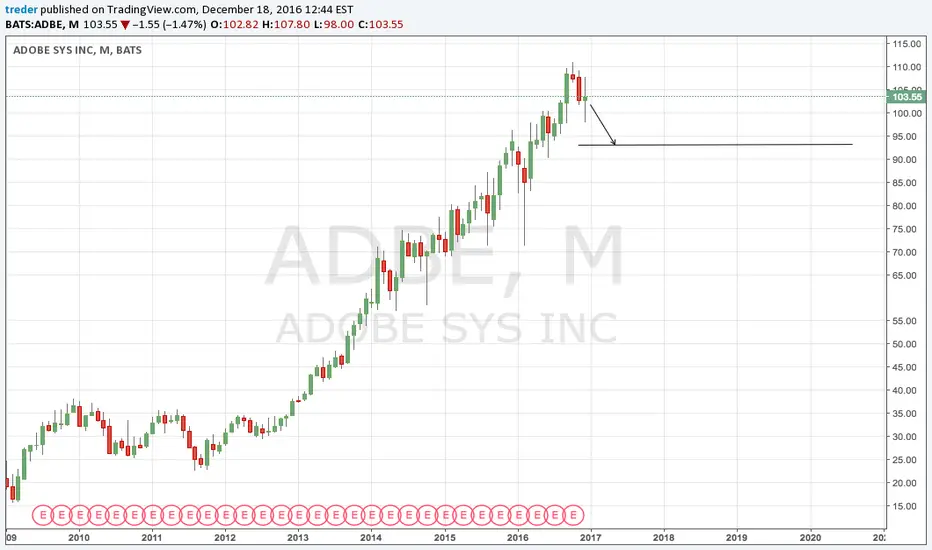
Adobe $ADBE Possible trend reversal. Ramping up into earnings.12/12 Trend line reversal
Looking to break resistance at 105.45


