Technical Analysis on Advent Technologies Holdings (ADN)The chart for ADN clearly illustrates its performance: a rapid surge at the end of 2020, followed by a consistent decline from 2021, leading to a 99% drop in value.
After reaching its lows around $1.70, the stock entered a sideways consolidation phase that lasted several months. It then staged a strong recovery with a gap away and a breakout of the descending trendline.
Currently, the stock is in a compression phase, forming a Triangle pattern, with converging highs and lows.
Bullish Scenario
In a bullish scenario, a breakout above the triangle is required, ideally accompanied by an increase in trading volumes.
The Volume Profile indicates the absence of significant resistance levels that could hinder the upward movement.
Bearish Scenario
In a bearish scenario, the stock would need to break below the triangle. However, the Volume Profile highlights a high-volume node represented by the rectangle, which also contains the POC (Point of Control).
Before a sustained decline can occur, the stock would need to breach this strong support zone.
ADN trade ideas

ADN Advent Technologies Holdings Options Ahead of EarningsAnalyzing the options chain and the chart patterns of ADN Advent Technologies Holdings prior to the earnings report this week,
I would consider purchasing the 1.50usd strike price Calls with
an expiration date of 2024-1-19,
for a premium of approximately $0.17.
If these options prove to be profitable prior to the earnings release, I would sell at least half of them.
Looking forward to read your opinion about it.


ADNPlease take my advice as of a way of looking at the chart in a meaningful way but not as buying proposition you may get in disapointments if you do not check the information yourself. Thanks!! Lets start $ADN has been a volatile stock in the past days with a potential upside at the range price of $2.80 at my point of view as deep buy opportunity Cut losses if wrong at $2.60. i am giving a room of earnings of 50%

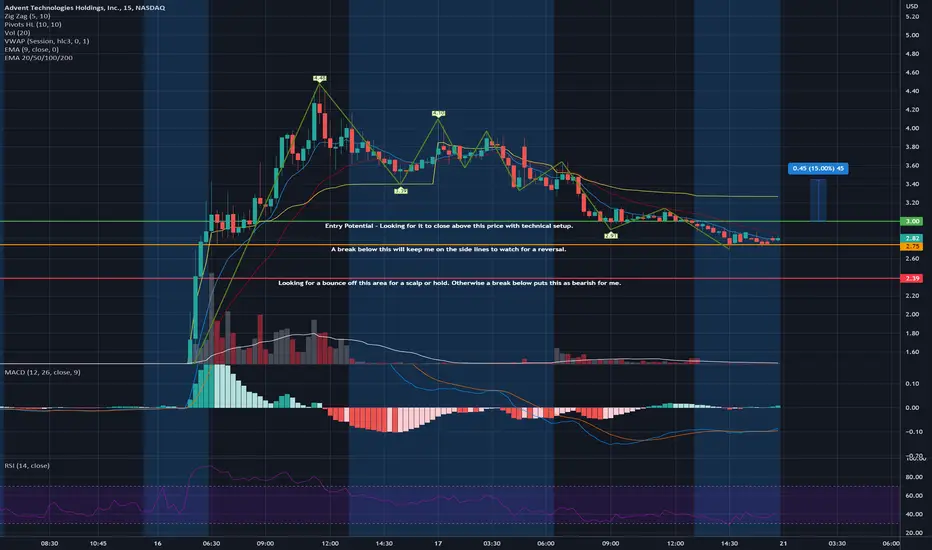
ADN - Potential Day Trade here? Looking for a reversal on this based on the rocket up from earlier this week.
If it breaks below my support range than I will move on. If I see a good technical setup then I may take a position at $3 for a 15% move up with plans to scale back positions as it goes.
Descending Channel Breakout for ADN?!?It appears as though ADN has broken flush to the upside of a descending channel which is drawn as two parallel declining lines drawn green on the chart, notice the rejection nearly exactly at the 200DMA.
On the KST there's a bullish cross where I've placed the green finger. More often than not when the KST gets this over-extended there's a sell-off immediately afterward with the rare exception of a continuation of s parabolic breakout on overwhelmingly bullish news.
A retrace to $1.40 is likely to re-test and build support on top of old resistance.
Or we're going to see a re-test of the 200DMA and a blue sky breakout.
Price target & trading range between $9.00 to $0.60c between now and the end of the year.

ADN most undervalued fuel cell and hydrogen technology play !Today i`ll share with you one of my private signals.
ADN Advent Technologies Holdings an innovation-driven leader in the fuel cell and hydrogen technology sectors has signed a technology assessment, sales, and development agreement with Hyundai Motor Company.
Remember last year`s rumor that Hyundai-Kia were close to finalize a deal to build the autonomous Apple car?
What if the deal is finalized and ADN`s fuel cell and hydrogen technology is in the Apple car????
This can be an easy 10X stock.
Last year The Goldman Sachs Group had a price target of $20.00 for ADN!
Looking forward to read your opinion about it.

$ADNBullish Butterfly harmonic pattern (not the best)
Dragon pattern
4hr and Daily classic bullish divergence on the MACD and RSI
Stop = Below horizontal support
1st Target = Resistance
2nd Target = ATH candle close

Perfect 3-bar reversal patternPositive reaction to a 3-bar reversal pattern with price action moving to form higher lows past daily resistance which is now support. Watching if it can maintain the above key s/r either for more upside or retest of daily support.
