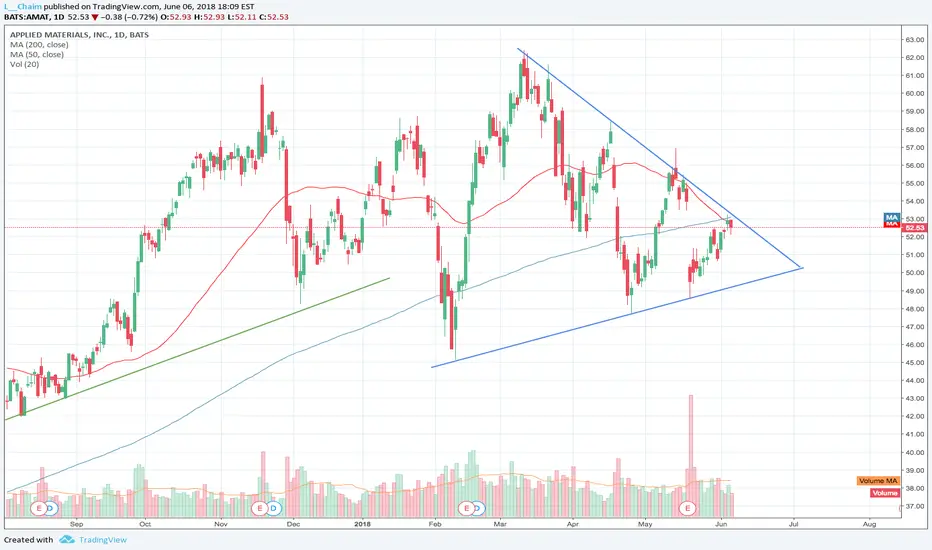
AMAT - Short term break outOnce it's breaks the falling wedge , enter with tight stop loss little below falling wedge .
AMAT trade ideas

Will AMAT bounce after the conference next week.There are always contradictions galore between one analyst and another. Between what the stock is doing and what the Analysts say it will do. That's why we have a saying "trade what you see" AMAT has a Strong buy rating but the same guy who gave it this status just lowered the price target on this stock. He's looking at the downward channel AMAT is in coupled with White House bumbleing and is just trying to cover his own corporate ass. "I told you I was less bullish on this one." Well no you have not told us that if you continue with your strong buy rating. Let's see if Thursday and Friday of this week have him move his rating back a notch to BUY if AMAT doesn't break out of this channel.
The market could get a bit of a tailwind with some earnings calls next week but last Earnings Season taught us to lower our expectation for that alone to pivot the entire Shabang and return us to a Bull market. In the Semi Conductor sector there are some great articles out there but it's all speculation. Micron needs to go on a run and show leadership in Semis if AMAT is going to remount it's 9 EMA. That would get many buyers paying attention. Until it can remount it's 9 ema it's just another dropping ticker Strong buy or not. Set your alerts and keep an eye. Semis can run. But it's got a ton of over head resistance where as Micron MU is today dropping below it's 9 ema and 50 MA. One good day and MU remounts and can run. I'm not expecting or seeing this happening. I think there's more pullback in MU before it move's to all time highs again but I think it's a Trade War and Market Cycle issue. MU is still a strong company. My alerts on AMD MU INTC NVDA will all be checked regularly.

$AMAT - Breakdown in progressNice lil descending triangle forming. Pretty tight resistance, almost makes it look like a wedge so I wouldn't be too quick to jump on some puts. Potential a bull trap if we see a breakout around / above $52.50. MFI in that parallel channel so we should see a next move coming soon. Healthy looking dip for the most part; most ideal short entry for bears would be if price could fakeout-breakout to test 180WMA ($53 more-or-less).


Beautiful trade..3% return in 2 days...sometimes things just fly2 days ago Applied Materials found support level at $47.2
This was a good opportunity for traders to take a long trade.
2 days later it flew to $49.8

Beautiful trade..3% return in 2 days...sometimes things just fly2 days ago, Applied Materials found support level at $47.2
This was a good opportunity to take a long trade. 2 days later it flew to $49.8

Some Ideas About AMATPotential ascending wedge confirmation likely by EOW, nearing consolidation. look for headfakes based on volume. follow money inflows and outflows via options. At support as of to day, 6/19/18, next stop is likely additional 10% down. Positives are RSI AND MACD poised for positive movement, but offer little to no guarantee of future performance. glta

APPLIED MATERIALS - HOW TO DETERMINE WHEN A STOCK IS FAILINGBasic Trading Techniques Explained (For This Example I Charted Applied-Materials)
I believe AMAT-is a failing stock. I have prepared this tutorial for you for two reasons: to keep you from losing money in a bad position, and to allow you to set up a chart of your own. Then, when you see a "hot tip" on TV, you can determine if the financial asset is worth YOUR MONEY.
1. Establish the direction of the trend . An effective way to do this is to use a 150 to 180 point regression line. This can be weekly, daily hourly (any time duration you wish to trade). Nevertheless, a 15-minute chart is not nearly as strong as a daily or weekly period. You can base the regression line on the close, but I like open, high, low, close divided by four.
2. Use a price channel, two if possible. Most trending stocks repeat within a channel. I like a 20-day channel, and I have found that if a 20-day channel is violated on the low side, this triggers “sell stops” from traders. The next channel is a 50 day. If this fails on the low side, the established trend may reverse.
3. Ichimoku Cloud . This is a great indicator and I recommend that you use it.
4. Mean reversion. If you study financial instruments, in this case stocks, they tend to oscillate up and down around the “mean”, or the regression trendline. If a stock is at the upper band of a 20-day price channel, do not chase it, because it is likely to “revert to the mean”. Better yet, if you have an up trending stock, let it fall (at least) to the lower band of the 20 day price channel. Why? Because the price will tend to “revert to the mean”.
5. ADX . The ADX is a green line, red line, and black line. If the green line is on top, the trend is up. If the red line is on top, the trend is down. The black line indicates the strength of the trend. For example, if the black line is rising, the trend (up or down) is getting stronger. Always use some form of trend quality indicator. Another such “trend quality” indicator is “Aroon”.
6. RSI or Stochastics RSI . These indicators will guide you in the “mean reversion” you plot. For example, the RSI at 80 will tell you that what you are plotting is “over-bought”. Caution: an RSI indicator, in something that is “breaking out to the upside”, can remain over-bought for long periods. You should use some of your other indicators, such as the “Awesome Indicator”, to guide you on trend reversal. The "AO" is a series of green and red horizontal bars that show you strength and weakness in a stock.
7. The Choppiness Index (CHOP ) is an indicator designed to determine if the market is choppy (trading sideways) or not choppy (trading within a trend in either direction). CHOP is not meant to predict future market direction; it is an indicator to be used to for defining the stock’s trendiness only. Higher values equal more choppiness, while lower values indicate directional trending. This is used with….chop zone.
8. I use a chop zone indicator that is green for up-trend, red for downtrend, and white for no trend. If you combine this color-coded format with #7 above (choppiness), a green color with a “chop” indicator line that is falling would indicate a strong trend. If the chop line breaks below the lower band, this indicates a statistically significant event (up for green, or down for red). This will tell you that the trend is very strong.
Today’s Wisdom: “Wall Street is the only place that people ride to in a Rolls Royce to get advice from those who take the subway.” Warren Buffett
I hope these trading tips help you.
May all of your trades go well.

DO YOU LIKE CHIP DIP ? ARE SEMI'S READY TO SLOW DOWN ?The semiconductors have had a great run in the past year, but I recommend we use caution.
For example, AMAT-is really having a hard time advancing through its year 2000 bubble .com highs.
Does this warn us of trouble for the chip stocks? I believe the answer is yes.
Some of the new technologies may make stocks like NVDA-or-CY-keep going for a while, but....
I have seen this danger before.
Use caution.
One other note: adjusted for inflation-AMAT is 20% under its year 2000 peak.
My next chart will be of-INTC.
This stock is not even close to its year 2000 peak. And, adjusted for inflation, it should be 20% higher.
Don.


Tech Bubble 2.0 About to BurstApplied Materials is a $50B market cap big player in the semiconductor industry. The current trend is probably why Facebook is starting to look at making it's own chips: www.investopedia.com
We can see in the 1 month view that we are in a meta bubble, an exact replay of the 2000 tech bubble.
Ride the wave, but get out ahead.

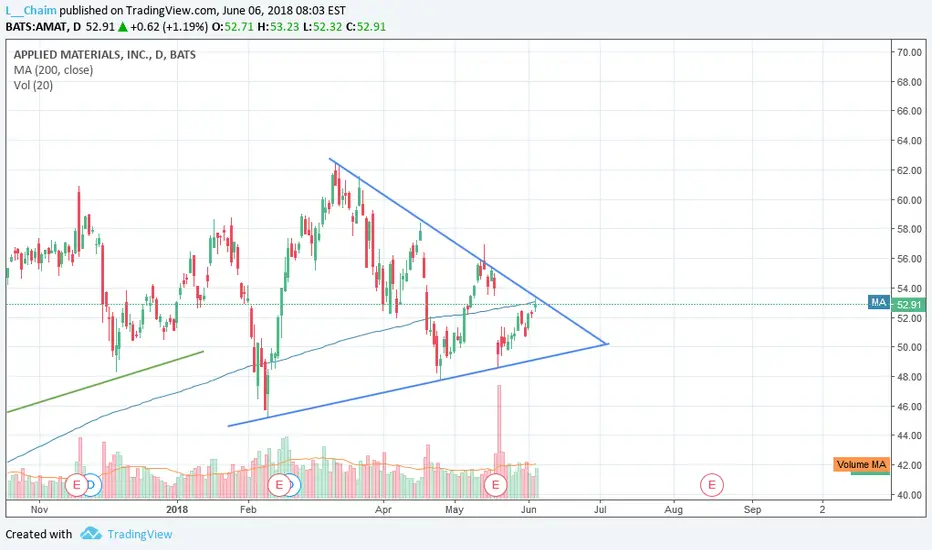
Applied Materials TriangleApplied Materials is forming a symmetric triangle. Watch for a breakout and continued bullish momentum.

AMATI'm trading up an down the wedge here. Well only up because I use Robinhood. But this one is fairly simple. Maybe it will breakout, up or down.
Meanwhile trading in the wedge.

LONG AMATAmat has been on consistent rise since its falls a few days ago! I think the momentum can continue as the chips in general are strong and the charts are OK.
The options (calls) expiring next week are cheap as well.
I might get into this if there is a pull back!

AMAT - Buy the post-earnings dipThe fundamentals:
Another quarter of solid growth for Applied Materials, who provide equipment used in semiconductor fabrication. While investors cheer on (the now overbought) MU, AMAT also has room to grow. Even if growth appears to be slowing, this dip puts it at a good price.
The technicals:
RSI(15) is just under 50, meaning it is neither overbought nor oversold. The current price is also in the bottom half of the Bollinger Bands. EMA50 has been decreasing for the past 2 months, but remains above EMA200. Implied volatility (IV30) is around 30% for options.
The play:
Long under $52, targetting $58. Buying calls can be a good play while volatility is relatively low. You can also sell covered calls

LONG $AMATEven though AMAT recently missed earnings this quarter and received a sell recommendation by many analysts, I see this as a good buy opportunity. We have seen steady upward growth from AMAT and they've had pretty unusual volume when it comes to recent earning plays. I see consistent support in these troughs, the RSI is recovering and believe this stock will bounce back in a big way the next couple months. Something I am personally holding in my portfolio.

At this price AMAT is very ineterestingTriangle is in process and all fundamentals are showing that the upside will prevail. Next target 60.

AMAT Gap Down on Guidance - Right Down to Strong Support. . .Applied Materials fell hard on guidance today. Did AMAT stock get put on clearance sale with the drop?
Whether or not the stock deserved to fall almost double-digit percentages on the day is subject to debate, but the important thing is it fell to a very strong support level - and the tech story continues to look good.
Thank you for for lending me your attention!
AMAT provides equipment and support for chipmakers. There are several reasons why chipmakers are going to see robust business in the coming months and years - AI, automation, blockchain, I.o.T, data, etc. - meaning Applied Materials' customer base is ready and willing to do robust business with the company. As the automation and data gold rush continues, AMAT's customers will be buying more and more equipment and services.
There's also the 5G wildcard - while slow adoption of 5G technology doesn't necessarily hurt AMAT's business, a 5G tech connectivity boom would be a great boon to AMAT's prospects.
The technicals are as good a story as the fundamentals. Applied Materials fell from the low\mid $50's to close around $49.50 (down a little more than 8%) on 5/18. Looking back on the chart, we can see that the $48 area provides a strong support floor. AMAT approached that support zone intraday as selling momentum pushed price lower during the early trading hours - and selling pressure as well as lackadaisical summer trading may see price through to lower levels in the coming week or two - but Applied Mat'ls miss on expected guidance doesn't change the overall situation of the company or the tech sector.
Gaps like these tend to fill. Look for price to trend higher as tech remains strong and the chip manufacturers continue to buy products and services from AMAT, and as traders take advantage of the early Memorial Day sale price of Applied Materials' stock.
Please like, follow, and share, and maybe we can have fun and do great things together.
Thanks again!
See it on the site: holsturr.com/category/markets/charts/
** For speculative and research purposes only - good luck! **


Short AMAT - Two areas of interestAnalysis on AMAT , Two areas of interest mentioned on the chart
First -
Short @ $54.58
Stop Loss - $55.46
Profit - Target 1 - $52.53 , Target 2 - $51.55
Breakeven - When price move to 53.50, SL to be changed to Entry Price

Very fine materials, i believe this company could go to the moonWhat i want to see, Consolidation 3-4 months , then a breakdown to 45 $ then i go long ! might be a good for end of the year
