AMD Doji on the hourlyGreetings
AMD has a doji candle on bottom of an upward parallel channel on the hour chart which could possibly mean a reversal.
Aslo even though it is quite subjective it could be forming a high and tight flag.
Negatives- it can consolidate further or have a breakout to the downside.
AMD trade ideas

Possible 12M levels for the AMDAMD needs to close near or above the 12M inside bar to be positive for the next year ,tried a bo of the level but failed and fell back inside the range ,will share some other patterns in the below comment section, also the monthly and weekly levels , it seems to forming a doji in 12M tf

Not sure about this one, but I just went longI had this 265 day cycle charted since June was speculating if it would play out. Everything is in full send Euphoria mode so I think we get at least a reclaim of the ATH from here.


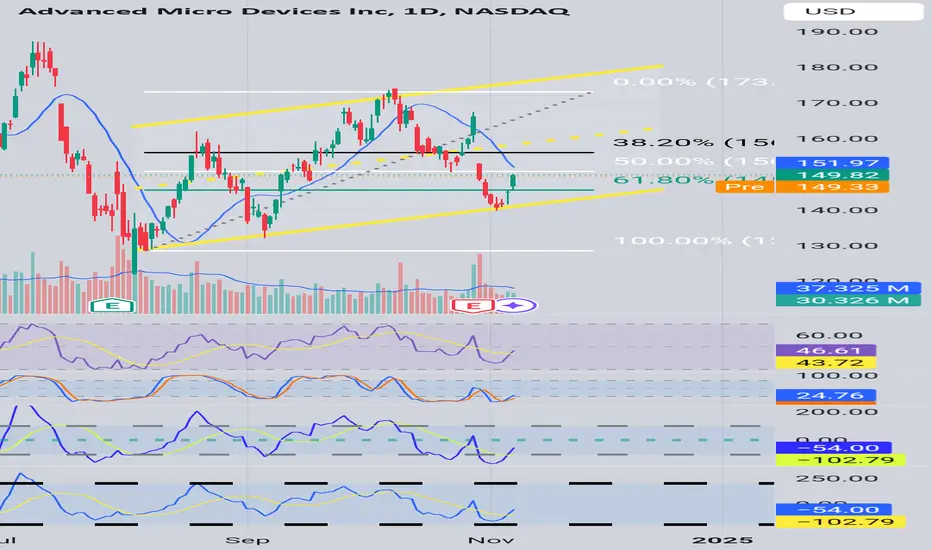
AMD charging up???Many thanks to @ProjectSyndicate for bringing up this Asset very smart person, everybody check his analysises. Here we have AMD on the day chart it has healthy SRSI and RSI levels and it is looking like it may possibly cycle up from the bottom upward parallel channel. It currently has a green candle on the golden zone in the Fibonacci.
Can AMD hit 240 USD in Q1 2025? 100% BUY/HOLD for the bulls.🔸Time to update the AMD trade setup, this is a speculative bull flag
with pole setup in progress, with 100% upside potential.
🔸AMD massively trailing behind NVDA entire year in 2024, expecting
AMD to catch up next few months. Currently price action compressing
withing bull flag, based on measured move projection expecting price
target is 240 USD, so this 100% upside from the entry price for the bulls.
🔸Recommended strategy bulls: expecting pullback to complete near 120 USD in December going into holiday seasons, limited downside beyond 120 USD. BUY/HOLD near 120 TP bulls is 240 USD, which is 100% upside. Expecting target to get hit in Q1 2025. good luck traders.
🎁Please hit the like button and
🎁Leave a comment to support our team!
RISK DISCLAIMER:
Trading Futures , Forex, CFDs and Stocks involves a risk of loss.
Please consider carefully if such trading is appropriate for you.
Past performance is not indicative of future results.
Always limit your leverage and use tight stop loss.

2 Bullish Scenarios on AMD!🔉Sound on!🔉
Thank you as always for watching my videos. I hope that you learned something very educational! Please feel free to like, share, and comment on this post. Remember only risk what you are willing to lose. Trading is very risky but it can change your life!

AMD Stock: Poised for an Upward TrendBased on the current technical analysis of AMD's stock, there are several indicators suggesting that it is at a favorable price and poised for an upward trend.
Key Points:
Volume Profile: AMD's stock price is currently below the Volume Profile on the daily chart, indicating that it is trading at a relatively lower price compared to its recent trading range.
Historical Trend Line: The stock is approaching its historical trend line, which often acts as a support level. A bounce off this trend line could signal a continuation of the upward trend.
Ichimoku Cloud: The price is currently within the Ichimoku Cloud, which indicates a period of consolidation and potential for a breakout. A move above the cloud could signal the start of a bullish trend.
Conclusion:
Considering the above factors, AMD's stock appears to be at a good price and is likely to continue its upward trend. The combination of technical indicators and the approach to key levels provides a strong case for potential growth.

"Buy the Breakout!"As seen from past data, when NASDAQ:AMD has broken out of its wedge, it leads to another move down before more upside.
Could this time be different?


AMD scenarioToday we are in a distinctly upward trend, we set a high and now we are correcting in a corrective way to the 0.5 areas of the trend (Fibonacci) + to interesting liquidity areas.
In my opinion, we will receive a continuation of declines according to the scenario I drew - in my estimation, the distribution of dividends at the beginning of 2025 will bring in smart money - we will receive a decline into buying and then we will begin to build long-term positions up to an all-time high.

My last resort for a bull caseI admit the earnings reaction was a bit of a surprise to me, but I'm only writing this because I was in denial of the technical signs I clearly saw. The Oct 9 - Oct 23 leg down was in five waves, so I should've anticipated that upon the earnings, we will move down - the move up in the days prior to the earnings was in three and retraced to the 61.8 - 78.6% zone.
Right now, I am leaning towards a $100 price target, I give it about 90% chance. However, I am giving it a tiny chance that the set of threes which have been printing since the March 8 ATH is forming an ABCDE triangle. If so, the local low is in and we move higher from here.

AMD’s Earnings Stumble | A Golden Opportunity for Investors?Post Earnings Dip, Is AMD ready for a 2025 Comeback?
Shares of Advanced Micro Devices dropped over 10% after releasing its third quarter FY2024 earnings report, which fell short of investors’ expectations. Although the results were not poor, the market had high hopes given AMD's premium stock valuation. The company did surpass revenue projections, but its non GAAP EPS matched market expectations plus the midpoint of its fourth-quarter revenue forecast slightly missed estimates.
In my prior analysis, I upgraded AMD from a sell to a buy after a 20% dip, which realigned market expectations. Since that upgrade, the stock has climbed 15%, outperforming the S&P 500 Index by 9%. The recent earnings-driven decline has brought AMD's stock price close to my previously mentioned level.
While the gaming segment saw a sharper decline in revenue in 3Q, the Data Center GPU division continued to exhibit strong growth, boosting overall revenue growth and improving margins. I believe AMD is still in a strong position to further accelerate revenue growth and margin expansion in the fourth quarter and beyond. As a result, I see the post-earnings dip as a buying opportunity and maintain my buy rating on the stock, supported by its anticipated growth phase justifying its premium valuation.
For 4Q FY2024, AMD projects 21.6% YoY revenue growth at the midpoint of its guidance, with a $300 million potential variance. This growth is expected to be driven by continued expansion in Data Center GPUs. Although the midpoint guidance is slightly below market consensus, I believe AMD could exceed this number, given its track record. My estimate suggests a 24% YoY revenue increase, or $150 million above the midpoint.
3Q EPS Analysis Shows Margin Pressure
AMD has shown consistent margin improvement since 4Q FY2023, though the pace in 3Q didn't meet expectations. EPS aligned with estimates despite revenue exceeding forecasts, indicating margin challenges. Non-GAAP gross margin rose by 50 bps sequentially, while non-GAAP EBIT margin showed strong improvement, rising by 350 bps QoQ.
AMD forecasts a 4Q non-GAAP gross margin of 54% and operating expenses of $2.05 billion, driven by a favorable mix from its Data Center segment, which now represents 52% of total revenue. Management noted that gross margins in the Data Center segment are below the company average, focusing on customer needs and market growth for future gains. This contrasts with NVIDIA (NVDA), which reportedly has higher Data Center margins, though specific figures are not disclosed.
With a 4Q revenue consensus at $7.65 billion, AMD projects a non-GAAP EBIT margin of 27.2%, suggesting an additional 200 bps sequential increase. The company appears well-positioned for both revenue growth and margin improvement, despite its valuation declining after the recent stock pullback.
4Q EPS Outlook Signals Continued Growth
Although 3Q non-GAAP EPS met expectations, AMD’s growth accelerated from 18.1% YoY in 2Q to 32% in 3Q. However, the selloff post-earnings implies that investors anticipated even higher growth. Based on 4Q guidance, I estimate AMD’s non-GAAP EPS at $1.10, marking a 44% YoY increase.
AMD's FCF profile also improved, generating $496 million in 3Q, a 13% QoQ increase despite a one-time acquisition-related expense of $123 million. Higher capital expenditures are expected in FY2025 to support MI300 growth and maintain momentum.
Market Expectations and Valuation Impacts
Before the 10% post 3Q selloff, AMD’s EV/EBITDA TTM was higher than NVIDIA’s, but they are now on par, despite AMD’s margins and growth trailing NVIDIA's. AMD’s non-GAAP EV/EBITDA forward multiple is 46.3x, compared to NVIDIA’s 42.6x, and its forward P/E ratio is 50.4x, 17% above its 5-year average and higher than NVIDIA’s 49.7x.
While AMD's premium valuation can be justified given its growth acceleration, NVIDIA’s triple-digit EPS growth is not expected to continue. Moreover, NVIDIA’s gross margin recently declined, reinforcing the case for AMD’s valuation as it expands its growth in FY2025.
AMD’s stock has retraced to a 0% YTD return due to margin concerns and underperformance in Gaming and Embedded segments, though the latter is gradually recovering. However, the company’s strong Data Center gains and continued margin expansion indicate a solid growth phase. The recent selloff has recalibrated market expectations, and with ongoing AI-driven demand, AMD’s growth is likely to extend into FY2025, making the pullback an attractive buying opportunity.
What you think, Are you Moonish on AMD?

AMD Short IdeaAMD went from having a strong bull flag breakout to back down below the last retest of the descending channel. It's always even more bearish IMO if you have a fake out like this. We also have a shorter term bear flag break.
Will be looking for a break and retest of the primary uptrend below, or if it holds it could work as a long if it holds the $130-$132 area. I'd prefer to be bearish for now considering the recent fakeout and failure to hold previous support.

AMDA leading diagonal and a three-waves pulback to the Fibo cluster. Looks beautiful, with the targets well above $300.
Bought a starter today, will add as it moves to the upside.

AMD Can it survive this horrific week?On August 13 (see chart below) we called the start of the new long-term Bullish Leg on Advanced Micro Devices (AMD), as a week before it entered the 2-year Higher Lows Zone and rebounded:
Still, the road (green Channel Up) isn't without its hurdles, and one of them is this week where the price is again being brutally sold towards the Higher Lows Zone. Notice that during the previous 2-week correction (August 26 - September 03 1W candles), the Zone's top was tested and held.
As a result, the multi-year trend remains bullish and will be this way for as long as the Higher Lows Zone holds.
It is interesting to observe at this point that the Bearish Phase of this pattern (March 04 - August 05) was in the shape of a Bearish Megaphone and can be compared to the one that bottomed on October 10 2022 and practically started the new Bull Cycle.
Notice also that so far each Bullish Leg (green Channel Up) rose by +141.87%. Within this comparison, and if we plot the Fibonacci levels from the Leg's bottom to top, we can see that the first Bullish Leg also had a rejection on the 0.618 Fib level and pull-back below the 0.786 into the Higher Lows Zone.
Obviously the current correction isn't ideal but it is not something we haven't seen and is within the tolerance levels of this 2-year pattern.
We expect another +141.87% rally to be concluded on this Bullish Leg, so our Target is straight up $295.00.
-------------------------------------------------------------------------------
** Please LIKE 👍, FOLLOW ✅, SHARE 🙌 and COMMENT ✍ if you enjoy this idea! Also share your ideas and charts in the comments section below! This is best way to keep it relevant, support us, keep the content here free and allow the idea to reach as many people as possible. **
-------------------------------------------------------------------------------
💸💸💸💸💸💸
👇 👇 👇 👇 👇 👇

AMD: The Next Major Support Level!Key Observations:
Daily Chart (Left)
Support Level Break: AMD has lost the critical support level at $148.01, indicating potential continuation of the bearish momentum. This breakdown suggests increased selling pressure, possibly leading to further declines.
Large Bearish Candle: A significant bearish candle following the support break after earnings reinforces the bearish sentiment, signaling that sellers have taken control after the support failure.
Weekly Chart (Right)
Long-Term Trend Line: The price is approaching a long-term trend line, which has historically acted as strong support, since Oct 2022. This trend line is crucial as it could provide a possible area for a bullish bounce or, if broken, lead to a long-term reversal.
Overall Bullish Structure: Despite recent declines, the overall weekly structure still holds a long-term uptrend. However, since it topped in March this year, we don't see AMD making higher highs/lows, and this could be a problem, especially if AMD loses this trend line in the next few weeks.
Conclusion:
AMD’s breakdown of daily support at $148.01 signals bearish momentum, and now it seems that AMD is seeking the weekly trend line, which serves as a crucial support area to watch for potential bullish reactions. This is our last major support level, as if AMD loses it, we'll see a big reversal in play.
For more detailed technical analyses and insights like this, be sure to follow my account. Your support helps me continue providing valuable content to help you make informed trading decisions.
Remember, real trading is reactive, not predictive, so let's stay focused on the key points described above and only trade when there is confirmation.
“To anticipate the market is to gamble. To be patient and react only when the market gives the signal is to speculate.” — Jesse Lauriston Livermore
All the best,
Nathan.

BUYS ON AMD💡 Today we analyze Advanced Micro Devices (AMD)
AMD is a robust company with an upward trend over recent years. Currently, following quarterly results that fell below expectations, it’s approaching a key support zone at $135, aligned with its long-term upward trend line, which could present a strong opportunity for mid/long-term investors.
1. Strong Position in the Sector: AMD is a leader in the semiconductor industry, excelling in advanced processors and expanding into artificial intelligence and data centers.
2. Constant Innovation: Its ability to adapt to new demands, such as AI, gaming, and cloud computing, strengthens its competitiveness.
3. Technical Potential: The $135 level is an important support and could be a rebound point in its general trend.
This analysis is not an investment recommendation.

$AMD - puts below $147.50 at 0.5 fib level.AMD - Stock down on earnings report now testing 0.5 fib level at $147.87. if breaks next support at $141.66 at 0.618 FIB level. Stock is weak on indicators looking for puts below $147.50.

Amd - Break, Retest And New All Time Highs!Amd ( NASDAQ:AMD ) is about to start another +100% rally:
Click chart above to see the detailed analysis👆🏻
Amd just retested and rejected a major previous horizontal structure and is starting the next major bullish wave towards the upside. Looking at previous cycles and the rising channel pattern, it is quite likely that Amd will follow Nvidia and create new all time highs soon.
Levels to watch: $130, $270
Keep your long term vision,
Philip (BasicTrading)

AMD is looking spicy!boost and follow for more ❤️🔥 Chart kind of speaks for itself, AMD is at trend support and support zone making it a cluster support zone. Rally to 182 - 212 targets 🎯 is very possible and can happen in the next few months..

Stock Analysis: Advanced Micro Devices (AMD) – October 30Technical Analysis and Price Targets
Following AMD’s Q3 2024 earnings release on October 29, the stock is still positioned within a symmetrical triangle, signaling a potential breakout. The updated earnings data, along with key technical indicators, provide a refined outlook on AMD’s likely price movement.
Bullish Scenario: A breakout above $170 could push the stock toward two main targets:
Target 1: Around $186, aligning with previous resistance, would likely confirm buyer strength and signal renewed upward momentum.
Target 2: Around $225.50, which would represent a multi-year high, indicating strong investor confidence in AMD’s growth potential within the AI and data center markets.
Bearish Scenario: If AMD fails to hold support at $140, a breakdown could target lower levels:
Target 1: Around $128.66, representing an initial support level that may signal sustained selling pressure.
Target 2: Around $93.62, which would suggest a significant downtrend if broader tech market sentiment or sector-specific risks intensify.
Key Technical Indicators
Moving Averages: AMD’s 50-day moving average crossing above the 200-day average, forming a “golden cross,” suggests a potential bullish trend. Confirmation, however, is needed through a breakout above resistance.
RSI: The Relative Strength Index is at 43, suggesting neutral-to-slightly oversold conditions. This leaves room for a potential bullish move if positive sentiment gains traction.
ADX: With an ADX of 17, the current trend lacks strong direction. A rising ADX following a breakout would confirm the strength of the next move.
Q3 2024 Earnings Summary
-AMD’s Q3 earnings exceeded Wall Street estimates, with revenue reaching $6.82 billion compared to the expected $6.71 billion
SHACKNEWS
-The revenue increase was largely driven by the data center segment, which recorded $3.5 billion in sales—a year-over-year growth of 122%
MARKETBEAT
-This performance highlights AMD’s successful expansion in high-growth areas, particularly with its EPYC server processors and products geared toward AI applications.
Despite the strong earnings, AMD’s stock reaction was mixed. The stock rose by $6.33 during regular trading hours on October 29 but fell by over $10 in after-hours trading. This cautious response likely reflects broader market concerns, including rising interest rates, economic uncertainty, and geopolitical factors such as U.S.-China trade tensions that may impact supply chains and production costs for semiconductor companies
Sector and Economic Context
AMD’s data center success comes amid a semiconductor industry facing complex conditions. Demand for AI and high-performance computing continues to drive growth opportunities. However, recent U.S. restrictions on chip exports to China and efforts to relocate manufacturing to the U.S. add layers of uncertainty. While reshoring may benefit companies like AMD in the long term, it could also lead to near-term logistical challenges and added costs.
Macro factors, including high interest rates and potential economic slowdowns, also pose risks to tech stocks. Growth stocks like AMD are often more sensitive to rate hikes, as higher borrowing costs reduce the appeal of future earnings.
Investment Strategy
For Bullish Traders: If AMD breaks above $170 with high volume, it could signal a buying opportunity, targeting $186 and potentially $225.50. Given the company’s recent performance in AI and data centers, such a move would reflect confidence in its strategic direction and growth potential.
For Bearish Traders: A breakdown below $140 could indicate a bearish setup, targeting $128.66 initially, with a possible extension to $93.62 if selling pressure intensifies. This approach may be favorable for traders looking to capitalize on downside risks associated with economic uncertainty and sector-specific challenges.
Long-Term Investors: Those with a long-term perspective may see AMD’s current price consolidation as an opportunity to accumulate shares at a reasonable price, especially given its strong positioning in AI and data center markets. A cautious, dollar-cost averaging approach could mitigate short-term volatility while taking advantage of AMD’s growth potential in the semiconductor industry.
Conclusion
AMD’s Q3 2024 earnings highlight the company’s strength in high-demand sectors, yet the stock’s mixed response indicates investor caution. The anticipated breakout from the current triangle pattern will be crucial in setting the next trend. As AMD navigates a rapidly evolving industry landscape, investors should stay vigilant for both technical signals and broader economic developments to inform their strategies.

AMD Trend RetestBig oof for AMD after earnings, but perfect retest of the channel/triangle breakout this morning. If it can maintain, I like the long up to fill the gap at least, next targets after that are $187 and $215 from another idea.
