Wyckoff Distribution Campaign The Wyckoff Distribution Campaign is a concept from Richard D. Wyckoff's market theory, which helps traders understand and predict price movements in financial markets, especially within the context of stock market cycles. The campaign focuses on identifying and analyzing the phases of distribution, where smart money (large institutional investors) is gradually selling off their positions to the general public before a market downturn.
Here’s a breakdown of the key components and phases of the Wyckoff Distribution Campaign:
### Phases of the Distribution Campaign:
1. **Preliminary Supply (PSY)**:
- This phase marks the beginning of selling pressure. It’s characterized by a noticeable increase in volume as prices approach a peak. The increased volume indicates that large investors are starting to sell their positions.
2. **Buying Climax (BC)**:
- The price reaches a new high, but this is accompanied by heavy volume and often wide price spreads. This is where the bulk of the selling by institutional investors happens, misleading less informed traders into thinking that the market will continue to rise.
3. **Automatic Reaction (AR)**:
- After the Buying Climax, the price drops due to the imbalance created by the heavy selling. This reaction usually happens on decreased volume, as the selling pressure temporarily diminishes.
4. **Secondary Test (ST)**:
- The price tests the levels reached during the Buying Climax to confirm the top. This test can occur more than once, and it's marked by lower volume than the BC, indicating reduced demand.
5. **Sign of Weakness (SOW)**:
- A significant price decline occurs with increased volume, suggesting that the supply is overcoming demand. This indicates that the distribution phase is progressing, and the smart money is continuing to sell off their positions.
6. **Last Point of Supply (LPSY)**:
- This phase represents the final rally or upward movement before the market turns downwards. The volume during this phase is usually lower, and it signifies the last efforts to distribute the remaining positions at higher prices.
7. **Upthrust After Distribution (UTAD)**:
- In some cases, there might be a final push to a new high, which can trap unsuspecting buyers. This is the last deceptive move before the market begins a significant downtrend.
### Characteristics of Wyckoff Distribution:
- **Volume Analysis**: Understanding the volume at each phase is crucial. High volume during PSY and BC indicates strong selling pressure.
- **Price Action**: Price movements, such as sudden drops (AR) and tests of previous highs (ST), help identify the distribution phases.
- **Market Sentiment**: During the distribution campaign, the general market sentiment may still be bullish, creating an ideal environment for large investors to offload their holdings onto retail investors who are still buying.
### Practical Application:
- **Identifying Distribution**: Traders use these phases to recognize when the smart money is selling, allowing them to anticipate a market downturn.
- **Trading Strategies**: By understanding the Wyckoff Distribution phases, traders can implement strategies to short sell or protect their positions by exiting the market before significant declines.
In summary, the Wyckoff Distribution Campaign is a crucial concept for understanding market cycles and price movements, particularly during the distribution phase where large investors sell their holdings. Recognizing these phases can provide traders with significant insights into potential market reversals and help them make more informed trading decisions.
AMRK trade ideas

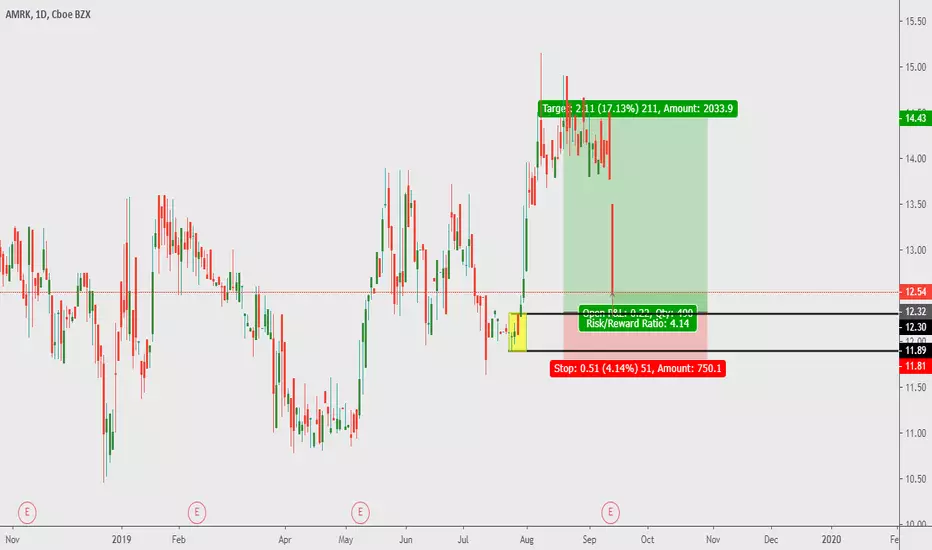
AMRK A-Mark Precious Metals Options Ahead of EarningsAnalyzing the options chain and the chart patterns of AMRK A-Mark Precious Metals prior to the earnings report this week,
I would consider purchasing the 35usd strike price in the money Puts with
an expiration date of 2023-9-15,
for a premium of approximately $1.92.
If these options prove to be profitable prior to the earnings release, I would sell at least half of them.
Looking forward to read your opinion about it.

$AMRK Bullish breakoutBullish breakout and good volume on A-Mark precious metals today up over 8%
Projected move is to $95 zone in next few weeks.
Really like the set up here with this stock consolidating nicely before each leg up and continuously grinding higher.
Bullish on anything coming out of the ground right now :)
Options chain was a little dry for me, I'm long shares.

A-Mark Precious Metals short of the mark. AMRKGoals 60, 55. Invalidation at 97.
We are not in the business of getting every prediction right, no one ever does and that is not the aim of the game. The Fibonacci targets are highlighted in purple with invalidation in red. Fibonacci goals, it is prudent to suggest, are nothing more than mere fractally evident and therefore statistically likely levels that the market will go to. Having said that, the market will always do what it wants and always has a mind of its own. Therefore, none of this is financial advice, so do your own research and rely only on your own analysis. Trading is a true one man sport. Good luck out there and stay safe

AMRK A-Mark Precious Metals IncSetting up nicely for a cup and handle pattern. Current momentum is bullish with a blended candle approach. This is a method that uses summation of candle patterns over 20 and 50 day period to provide short and medium term momentum action. The 20 day blended candle pattern is bullish and the 50 day is weak bearish at present which is a change from bearish momentum few weeks ago. Things are looking to continue trending up.


$AMRK.... "W" For The Win.95% above earnings expectations today! Anyone that happened to enter this trade prior to the report should be in for some good gains. This stock should barrel over the ATH and push the bar even higher. I'm almost certain after this report $52.30-$55.35 resistance area won't even be an issue.

AMRK Short William Alligator : the stock is currently in a bullish position because the candlesticks are above the Teeth, Lips and Jaw and the lines are “eating with an open mouth” this indicates that the stock is in a strong uptrend.
RSI : the line is above 70, so the stock is overbought.
Candlestick patterns : there are three white soldiers which are bullish confirmation.
Overall : it can be interesting to take a sell position on this stock because the stock is currently overbought. Entry price is lower than the current price for assurance and stop loss is set at 5%.

$ARMK - shows positive signalsThis is trying for ATH
It is on major support.
It maybe putting in cup n'handle, which means I could wait for the handle, there is supportive option bets in the form of puts for 4/16 for this ticker to be anywhere from $20 to $35/share. So there is pressure to keep it down so those puts pay out, but before 4/16, they may try to shake out the folks holding the contracts.
I like it, its strong and I think it goes up more before it comes down.
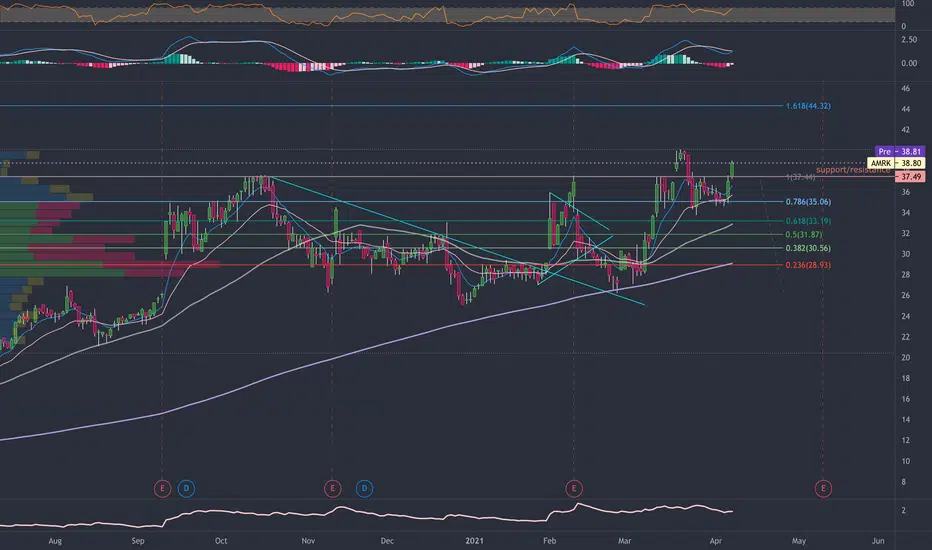
$AMRK - consolidation and minor DT breakThis has been consolidating for a month
Finally it peaked about the long term down trend.
Alerts for $29.40 and then $30.
Confirmation that it may want a short rally would entice me to be grab a few call options
I want to see the MACD lines above the historgram also.
The ATR and stochastic are ideally aligned.
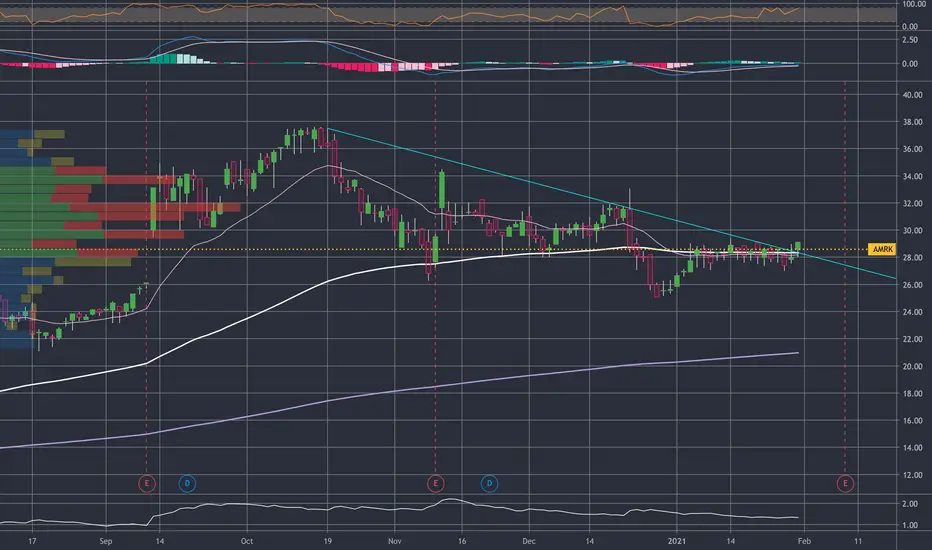

$AMRK Technical Analysis for 10-06-2020Volume is up +234% compared to typical volume over the past 6 months.
Price needs to hold above $35 or it may pull back to retest $33. It we continue higher, my targets are marked on the chart.

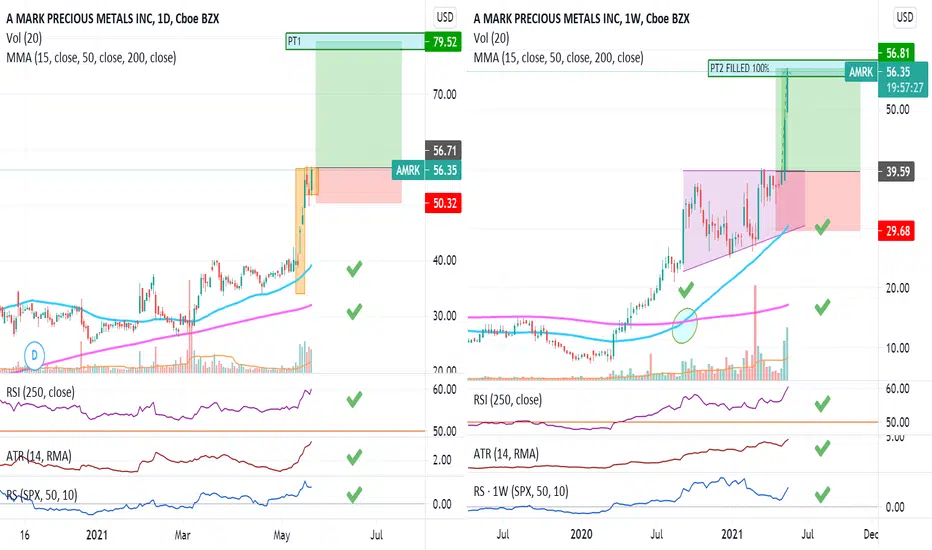
AMRK: Ascending Triangle, ConfirmedAscending Triangle, confirmed
Pros:
Descending volume during formation
Volume Spike at break out
PPS above 50Ma and 200MA
RS above 0 and ascending
R/R above 8, high
250RSI above 50, very high
200MA scending
ATR ascending, more volatile
Cons:
Target:
PT = 34,66$

AMRK:NASDAQ - A MARK PRECIOUS METALS Up 200% since mid MarchAmark has been having a good run. Bit of a pullback. Will wait to see which way it heads before taking a position. Could be worth a watch.

Some potential upsideDiscounted significantly, currently around 30% retracement and shooting for around a 45% recovery. MACD, RSI and Ultimate Oscillators all look like there are some opportunities here.
